Friday, December 14, 2012

AAPL Post

This s a hard one if you haven't been following the AAPL updates since about mid October, there are so many I wouldn't have time to find all of the links, but the bottom line was/is this: there are multiple trends developing at the same time, for instance I can have 3 trades open at once in the same stock, or lets use a market average for this example as it is easier. Maybe I have a short term call for some short term positive divergences in the market that I don't expect to be a huge move, but they are solid signals. If I simply bought say the SPY, the move might be worth 0.50%, but if I bought some calls instead with lots of leverage, I may be able to make 25% on that same move. However I have a longer term, say swing trade or maybe a bit longer, and I expect to see that average move down to a new low so in this case I might also have a long position in SPXU which is a 3x leveraged short ETF on the SPX, if I simply shorted the SPY for this anticipated move I might make 3%, but with SPXU I'll make more like 9 or 10% and then I have a longer term view, it might even be like August-October 2011 when the market was choppy and lateral and we were trading the swings, but longer term expected a new low to be made and that would kick off a long term trend to the upside. So my longer term view is after this swing low move is made, I expect the SPY to move up for 4-6 months and in this case I may just buy the SPY because counter trend moves in a leveraged product over the course of 6 months may create some significant draw down and emotionally make it hard for me to stay in the trade if I see SPXU down -18% on a counter-trend move.

That's just an example, but AAPL is similar in many ways.

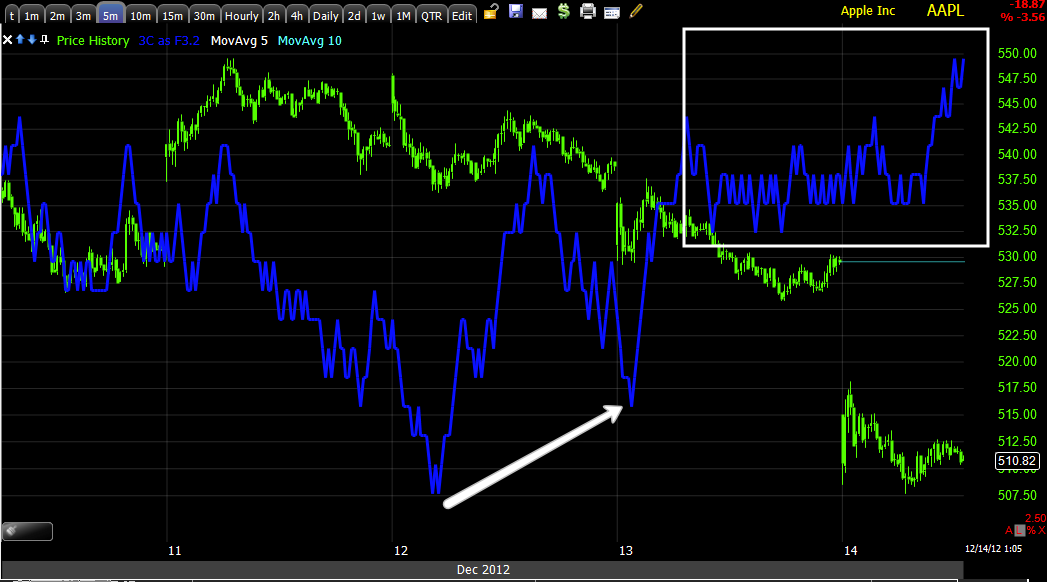
Since mid to late October there's been a long term base or some support structure building in AAPL, here's what it looks like.

 This is the 30 min AAPL chart with distribution at the all time highs sending AAPL lower, but since late October there's been a long term underlying support trend, I imagine it's probably a pretty large position being put together and takes time. I don't think this changes AAPL's ultimate trend which is bearish, but this could be a several month long rally. Note how it has gone from relative positive divergences to leading positive divergences, that means the underlying trend seems to be picking up steam and this is how these typically develop.

 Looking at that same timeframe, but closer, (I'm not sure what the pattern is, but I can imagine a "W" like base), at "A" we have the left top of the "W", at "B" we have the first bottom of the "W", in between "B" and "C" we have the second top of the "W" or the middle, at "C" we have the second and final bottom of the "W" and as we talked about yesterday in the context of a double bottom and how they have changed since Technical Analysis grew in popularity, these bases often see the second test fail as a head fake move lower so my expectation for AAPL has been that it would make a move lower than "B" so this may have been a put trade , but once we get in to that area, that's where I want to watch how AAPL reacts and how 3C reacts because that low may be the very best entry with the lowest risk to take advantage of this longer trend this base seems to be built to support. The finally right top of the "W" would be "D" which isn't here yet, but the next rally up and before that I'd want to be already in place with my position, so AAPL may be making a significant trend transition right now.


 This negative divergence is in line with most of the market from the rally/bounce from 11/16, when accumulating they want to buy as cheap as possible, not after AAPL came down a positive divergence emerged on the 15 min chart.

Not to confuse things more with an even longer trend, but this is the longer or longest primary trend which is leading negative on a daily chart, AAPL went leading negative at the top, the literal top and has made a new leading negative low, but this 30 min trend I'm talking about above , could send AAPL higher as in the green arrow to the right of price and that is a trade that is worthwhile, but ultimately when that is done, I want to look for a long term primary short in AAPL and that is the large red arrow to the right of price scale.

This is trend analysis using different timeframes and helps paint the picture and know what moves to use as tactical entries for strategic goals.

As for yesterday's call position, this is one reason I don't like to have options with only a week or two left on them and why I prefer January even though it's more expensive and may yield less profit, I believe you pay for quality. I'll be leaving that position open for now, I see no reason on the short term charts to close it.

 2 min positive

 3 min remains leading positive

5 min remains leading positive and adds to the divergence.

This also has ramification for that 30 min trend that I expect to produce a longer/stronger move up in AAPL as lower prices appear to be under accumulation in a strong way.

BEAV Short trade follow up

I mentioned BEAV yesterday as a short trade... There are a number of interesting longer term charts that support a short position in BEAV, but one of the features that suggested a BEAV short is very close was an ascending triangle right below long time resistance, either of which seeing a break above would likely trigger long orders and squeeze out remaining shorts as it would appear BEAV was breaking out to a new high, the triangle I showed you yesterday suggested this move was coming very soon (as in hours or a day), it appears to have come this morning on the open.

Expecting this I ended the BEAV post with this sentence, "This is why I like BEAV here, I'd prefer a 50% short position now and wait to see if we get a higher breakout to add the last 50%."

However with the way it went down, that would not have been possible or at least not likely, however this may mean that BEAV has cleared the baffles and may be ready for that move lower. All of the long term charts and short term starting at 5 min are still in line with a move down, the issue I have right now is the very short term charts-1 through 3 min are not providing a clear picture, but I wanted you to know about this so you can look and make a decision which can include being patient and waiting to see if something more concrete on the short end appears.

 Here's the 60 min chart with the ascending triangle that tells Technical Retail traders that BEAV is a long and a breakout to the upside, which is just below long term resistance as well is where they want to buy on confirmation. You might be able to make out a move on the open through and above both levels.

 Long term resistance at $48.48 and this morning's opening gap high at $48.73 takes out both levels, it does not make it easy for longs to enter unless they had a limit order in place, but it does trigger any limit orders or BTC orders.

 Here's the move on a 1 min chart, it was up there long enough to trigger any orders on the book, but not long enough for any traders who place their orders manually, we might want to wait to see if it moves there and allows them in to the trade, or you may just want to view this as the clear out that we usually see right before a trend reversal, it's hard to say because the short term charts aren't helping much. The 1 min can't be too helpful because of the many bars that have 500 shares traded or 100 or even zero, so we have to go to longer charts that don't have those gaps in trade.

 The 3 min chart is the rally first solid timeframe and as you can see it looks like there was a positive divergence late yesterday preparing for the gap this a.m. and yes, Algos can sell those shares in a minute easily, however in the yellow box, not much 3C information.

The 5 min and all the timeframes beyond that are supportive of a move down in BEAV, I guess you have to decide. I mentioned a partial or phased entry, maybe with the market seeing some strength BEAV sees some? Then there's the "It's only a fraction of a percent or a bit more, is it worth missing the trade?" Even a full short here still has minimal risk so long as you follow a risk management plan.

Any thing changes, I'll let you know.

Market Update

All of the short term charts look great here for an upside turn around.

AAPL is in a unique situation where it may be transitioning between trends, I'll be covering that soon, the longer term trend is positive.

Volatility Indicators

Yesterday afternoon I posted the 3C signals for the volatility ETFs, UVXY, VXX and XIV, all confirming short term divergences pointing to the market moving up in the near term (as in today).

There was a small change in the signals after I posted them near the close and then when Futures closed for trade in after-hours and re-opened shortly after, they had gapped down.

In any case, the volatility indicators seem to be back on track from yesterday's post. The only thing that I'm thinking about as far as short term trade goes is the weekly option expiration today, more and more we are seeing very dull Fridays as it seems they are even putting a lot of energy in to pinning the weekly options lately.

Here are the updates-
 VXX, moves opposite the market with a 5 min 50-bar m.a. which are closely watched by intraday traders.

 Yesterday's 1 min negative divergence in VXX (suggesting it moves down and the market up), but there was a small positive right in to the close (remember this when you see the ES futures for last night after the close below).

 VXX 3 min seems to be moving back on the negative course which should be supportive of the market, these worked on F_O_M_C_ Wednesday 3 of 3 times, even before the policy announcement.

 UVXY is the same as VXX, just leveraged so the same idea, it moves down, the market up. Again a 5-min 50 bar moving average.


 The 1 min chart yesterday was negative with a small positive in to the close (again remember this positive when looking at ES futures below).

 UVXY 3 min is still leading negative.


 XIV is the mirror opposite of VXX xo it tends to move with the market, it had a positive divergence in yesterday's post, after the post it put in a small negative, but it seems to be moving back in line.

 XIV 3 min is still leading positive.

 XIV 5 min-50 bar m.a.

 At the red arrow is the 4 p.m. market close, ES closed at 5:15 and gapped down when it re-opened at 6 pm, the white arrow is midnight EDT.


ES continued, midnight, then at the green arrow the European open and red the US open.


Opening a Speculative Call Position in SSO

This is a 2x leveraged long S&P ETF, UPRO the 3x leveraged has much less volume/liquidity.

I'm thinking SSO, December (December 22) $59 for a very short term trade- more or less a fade move, betting on the SPY moving up from here.

Again this, as with most options positions for me, is a speculative trade meaning risk management / position sizing should reflect that.

Opening Indications

There's a very interesting thing happening in the market with regard to our trend expectations or trend table, I'll touch on it later because I really need to think of the best way to explain it, but it's sort of like "Getting lost in the lines", if you do you miss the trend expectation that is playing out, but if you don't pay close attention to the details (get lost in the lines), then you are missing out on a counter-act that is just as important.

In any case, I'll touch on it later, but for now opening indications look pretty good across the board, even in AAPL.

 DIA 1 min is perfectly in line on the open.

 DIA 2 min is leading positive

 IWM 1 min is leading positive


 IWM 2 min is leading positive

 QQQ 1 min is leading positive

 QQQ 2 min leading positive


 SPY 1 min leading positive

SPY 2 min leading positive

QQQ Puts Closed


I usually don't like to wait that long or be in an option position that long, but I had a feeling they would make at least some money before expiration, at this time though the clock is really going to start working against them.

Closing QQQ Puts

These were puts opened last week on Tuesday when the market shifted very suddenly, the SPY looked strong for the next day while the Q's looked weak for the next day, that's the way it played out the next day as well, but I never closed those December $66 Puts, I'll be closing them now.

Future Indications Mixed

Both ES and NQ futurs are down, the difference is ES looks like it has a very good chance of fading the gap, NQ futures don't look very good right now and are in line with the gap.

 ES has a positive divergence in to the open

NQ is simply in line.

We'll find out soon enough

Thursday, December 13, 2012

AMZN Short Trade Follow Up

Yesterday I brought the AMZN short in the equites Model Portfolio (which is mainly used to track positions) up to a full size position,  I added

" I think AMZN could hit or make a head fake move  above and would be an even better entry, that is at the $256+ area because there is a fairly obvious range or resistance level there, but I don't have time to watch this stock that closely with everything else  I have to do for a model portfolio position."

Then I posted the charts...

There's a possible better entry for AMZN short, but it didn't come today, it may come tomorrow if we get a market move to the upside as several indications today are pointing to (Leading Indicators, Volatility ETFs, Futures divergences, Market Average Divergences, etc.). So there's not much to add to yesterday's charts and explanation, the only changes would be these...

 Daily chart, the red trendline is obvious resistance, traders will be watching that area and are likely to buy AMZN if price can break through that resistance, remember, traders always want to buy confirmation which often lead to them chasing a trade and ultimately starting a trade off from a bad area. If you saw all the charts from yesterday-linked above- then you know AMZN's highest probabilities are for a deep pullback or trend reversal so any breakout is almost certainly going to be a failed breakout and 3C should tell us in real time whether it's being sold or confirmed. We want the move up in yellow, short there and wait for the ride down.

I put small lines below the daily candles, the red lines are an established downtrend believe it or not, the 2 orange lines are noise as they are insignificant to the trend and don't damage it.


 AMZN 3 min saw a relative positive divergence at point A and the same leading positive we saw throughout the market at point "B", this is a short term timeframe, short term moves.

I included the SPY's chart today in the exact same timeframe and it has the same leading positive divergence in the afternoon so AMZN probabilities of the trade coming to us on the plan outlined yesterday and above, look pretty good.