The one interesting thing about Technical Analysis is that it is fractal, the same chart formations you see on an 1 min chart will appear on a 5 day chart.
Lets take a look at the SPY
The 10 min chart of the SPY shows what appears to be a double bottom, last week when I warned about a sharp sell-off and it came the next day, I also warned we'd likely be looking at a formation that is most likely to be a "W" bottom and these bottoms are often head faked with a break to a new low before moving up. On the 10 min chart, volume looks good for the formation and at the red arrow, we created a new low for this side of the pattern (since Thursday's sell-off)-that served as the mini formation's head fake.
Also Note the productive pattern in RSI.
Here's the daily chart version of what I thought we'd see, "W" shaped bottom, we are at the lows of the right section of the "W" so a head fake in this area would not be uncommon. Also note the productive pattern in RSI.
Here's the SPY 15 min chart, it's very positive right now for the "W" pattern.
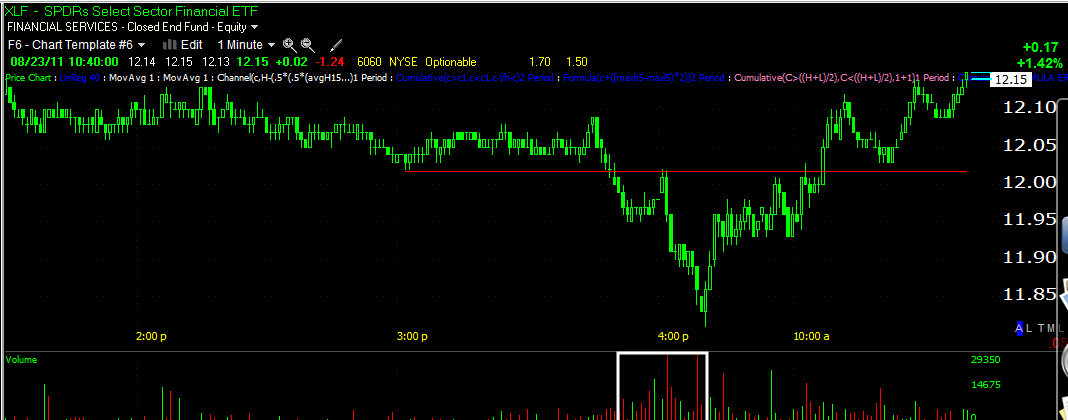
Here's XLF from yesterday's head fake, note how it triggered a lot of volume, hit stop and limit orders and now it has recovered, BAC is in a similar position, it just hasn't fully recovered yet. These head fakes can test our nerves, but they tend to be one of the best timing signals we have, so long as 3C finds them to be non-confirmed.


 | Theme by Thur
No comments:
Post a Comment