Friday, March 23, 2012

Boiling a Frog

The S&P-500 had its first week in the red for the year. Interestingly, just as treasuries seemed they were set to be the most hated asset, TLT posted a nice weekly close at nearly 3%. You may recall in my "market head fake" theory, treasuries were to be accumulated as one of the signs and despite all of the talk of how treasuries were about to fall off a cliff, they rally for their best week of the year, and why? Almost certainly a flight to safety trade. I should mention that Goldman issued a long equities call and a sell on treasuries this week, if you think they were wrong because they are out of touch with the market, think again, they needed to create supply in treasuries and demand in equities and you see how the week ended.

ES rallied just enough today to close the day session gap from 3/22, gap filling is what I suspected this rally was about and I didn't find it all that surprising as I noted last night, the market's advancers/decliners was so extreme yesterday tat usually it creates a short term oversold condition (which usually lasts about a day.

As for AAPL, I've had a lot of positive email feedback since I said late in the day that the big volatility moves have been on the gap, this is true for the rally and was true for the market this week on the move down on the 22nd. It seems to me, while the market moves lower, they use the day session to keep the conditioned (I almost said brainwashed) "buy the Dip crowd" hopeful and buy the dip they did, all the way to the year's first red close.

Here's an example-note the volatility on the gaps down where stops can't protect you from large losses, yet they still throw a bone of hope to the BTD crowd. This is what I would call "Slow boiling the frog".  You may have heard of this, if you throw a frog in a boiling pot of water, it jumps out, but if you slowly raise the temperature... Boiled frog!

I'll be back later with the internals and other interesting tidbits.


As usual...

 As the market rounds over and the 5 min 50 bar average is broken, the stops are hit.

The SPY is a better example...

Last AAPL Update

Unless something big happens...

 This is the AAPL 1 min chart, I'm guessing that this small positive divergence will be enough to keep AAPL from breaking support before the close, but that does make some sense.


The volatility in this market has been on the opening gaps down like this one in AAPL, a gap down through support will do a lot more damage then a drift down through it, risk management has a hard time with gaps.

NADAQ/AAPL

 Here's the DIA (green) vs the SPY (red), note volume on the advance, traders are not enthusiastically chasing prices higher.

 Now look at the QQQ in green vs the SPY... One guess why?

 AAPL is making another move toward support!!.

 The inline 3C reading of the last day and a half are giving way now, AAPL went negative here on the 1 min at the top of the most recent move up. Actually, leading negative.

The 2 min chart is doing the same.

I'd guess the other averages are in a race to fill their gaps (the QQQ already has) before AAPL breaks down.

AMZN-potential trade...

 I'm not 100% sure how to play this because a head fake move to $200 would be ideal, I love centennial marks, there are so many limit orders there that it draws price to them. However today there's also relative weakness in AMZN's performance (not percentage gain, but intraday performance). As you can see there are a couple of levels of resistance we are pretty much at right now.


 The Bollinger Bands are squeezing which leads to a highly directional move, a pop up to $200 and I'd be interested in shorting it there as long as the underlying trade continues to deteriorate, a break down may also be interesting, it depends on whether it breaks down in sync with a market break.

 Today AMZN made its highs early and hasn't made a new high with the market, not good relative performance.

 The 30 min chart has confirmed the move up, but today weakness is developing there.

 It is worse on the 15 min chart as you would expect.

Still worse on the 5 min chart which is just above a resistance level, but there are some higher.

This reminds me of the GLD short, I think I'd try to play it the same way, see if we can get a head fake move to $200+ and loo at shorting it there like we did with GLD.

I'd set some price alerts so you don't miss this one.

Market Update

Last night I suspected we'd see a bounce today based on the huge amount of decliners vs advancers, it's a sign of short term oversold and by short term I mean a day or sometimes less. When we see large dominant price/volume relationships, it often depicts the same, short term overbought/oversold. The market has been very diligent about filling gaps so it's not much of a surprise, although it looks like this is all being sold in to price strength.

The gaps left open..

 DIA

 IWM

SPY

 DIA short term 1 min still looks the worst today as it seems to be seeing increased distribution as it nears the gap.


 The weakness is now filtering in to the 2 min-remember yesterday and early today we had no signals as the market/3C were in line, now that is changing.

 DIA 5 min is now seeing the weakness filter in. In red it looks like resistance at a distribution candle.

 IWM from in line to a leading negative divergence, it's good to see the "in line" era passing.

 IWM 5 min is seeing the weakness as well in the form of a leading negative divergence

 The Q's have been the strongest thus far in underlying trade-think AAPL not having broken that support yet. However the negative divergence is now showing up.

 SPY 2 min, no longer in line and negative

That is starting to filter in to the 5 min.

GLD Update

Even if you are not in the GLD trade, there are a couple of common themes that are in this update that apply to all stocks and market averages, it's the new reality of technical analysis.


First for those of you who remember, the GLD options trade (PUT) was conceived at the white arrow. There was a zone of resistance seen at the red trendline and 3C was negative.  We almost never see a reversal without a head fake move first and the day before I posted that there was defined resistance and for GLD to fall, they'd have to sucker in the longs on a head fake move first. The next day GLD (at the green arrow) put in a parabolic move up. You know how I feel about parabolic moves, they almost always end badly and worse on the way down (in this case) or the way up if the parabolic move was down to start. You can see that concept held true as GLD lost a lot more ground and a lot faster when it fell. The yellow box is the head fake and that's where the put position was put on for a 215% 3 day gain.

 Another concept is that of mini capitulation seen at the left in the white box, big volume in an established downtrend (this is a downtrend for the timeframe), this almost always leads to a reversal, but reversals are rarely "V" shaped and more often "U" shaped. You can see support at the red trendline, again, before a reversal we almost always see a head fake / shakeout move which came yesterday in GLD as it crossed below support briefly. Note RSI was positive at the shakeout yesterday and as GLD is at resistance today, RSI is leading positive, suggesting more gains in the days ahead.

 Short term 2 min 3C caught yesterday's shakeout and was positive, meaning those who were stopped out had their shares accumulated and the move up came the next day (today).


 The longer term 5 min 3C shows a positive divergence at the end of the parabolic drop, it remained in line with price action and put in another more powerful leading positive divergence at yesterday's shakeout, today even though I think the gains for the day may be capped as we are at resistance, there is still a leading positive divergence in GLD, again suggesting more gains in the days ahead.

The long term 30 min chart shows very clearly the negative divergence on the head fake move up to the left at the red arrow and a positive divergence especially at yesterday's shakeout, it is also leading positive today. The reason the 30 min chart doesn't show the divergence as early as the 2-5 min charts is because it takes time for the shorter term chart's strength to filter through the longer timeframes, but the longer the timeframe, the stronger the divergence. So to wrap it up, I expect we ill see more gains ahead in GLD based on what we are seeing now.

Credit / Risk Assets / Currencies / Sector Rotation

It's amazing how many little thing move the market. I'm a believer in looking everywhere for the pieces of the puzzle. My second proprietary indicator ever created (the Trend Channel was the first), 3C, is a reminder of this philosophy, 3C="Compare, Compare, Compare", I use 3C that way in looking at multiple timeframes and I look at the market that way as well, you never know where the market is going to give you a very profitable "tell".


First, commodities vs the SPX
 You can see relative strength is pretty good in commodities today vs the SPX, although it's starting to fade a bit (+1.62%)

 GLD is part of this as we have expected a bounce here, and the recent trade action may be part of the reason commodities are starting to fade a little intraday.

 Yesterday I was asked by a member about USO, my reply was short term bounce, longer term (as of now), I remain bearish and more so in Brent crude vs WTI (USO for WTI, BNO for Brent). I think Brent is at much greater event risk via Iran then WTI (West Texas Intermediate)


 SLV has contributed to commodities advance today

 And copper which is also fading off a bit as the day wears on.

 Rates/Yields warned on the 21st as they went negative vs the SPX and the SPX dropped (orange arrow), yesterday they were in line with the market and thus probably part of the dull market action. Today yields are rolling over, positing another negative divergence vs the SPX.

 FXA, the $AUD (Australian Dollar) which is part of the carry trade which is being unwound (not good for the market), posted a positive divergence at the white arrow this morning. Note the previous negative divergence on the 20/21st that sent the market gapping down on the 22nd. Today the $AUD looks like it is hitting resistance so it will not be as supportive of the market.

 Here's the longer term trend in the AUD vs the SPX, this is part of the carry trade being unwound, the carry trade is what hedge funds and institutions use to finance risk on trades. The fact they are closing it out is not good for the market.

 Here's the Dollar, usually I'd use the Euro as it has a 50% weighting in the Dollar Index, but there' been a bit of a disconnect there so why not go right to the source. The $USD has an inverse relationship with just about every risk asset including commodities and equities. The $USD in orange (vs the SPX in green) shows yesterday dollar weakness sent the market a bit higher (arrows to the far left), then some dollar strength sent the market back down. This a.m. and late yesterday, the dollar fell and equities having hit support bounced from there. Right now there dollar has moved up a little and is at some resistance, I suspect it will break higher pressuring the market.

 Credit leads, equities follow. Here's High Yield Corporate Credit, it has been selling off since yesterday, it moved up a bit with the SPX earlier today, but refuses to move any further leaving it at a negative divergence, suggesting the price strength in the market today is likely being used to sell in to.

 The longer term picture of Corp. Credit, it has been in a downtrend, the yellow area is where I expected the market to make a head fake move up, I said the stronger the better as it will trap more longs and create a snowball downside effect. Credit is not going any higher as you can see and starting to sell off again, the effect on equities is clear.

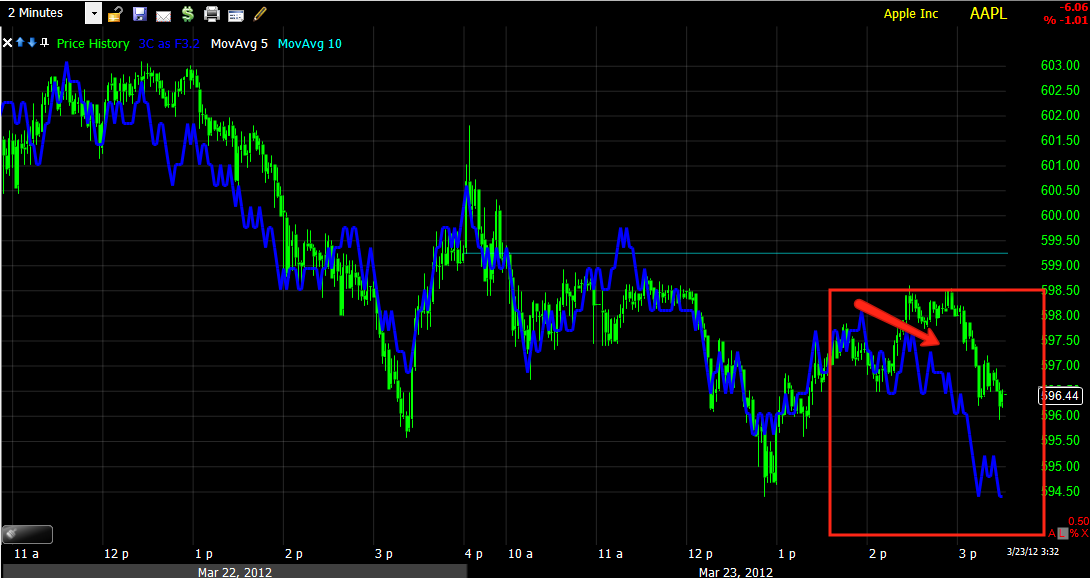
 XLK/Technology was leading the market most of yesterday, remember me saying the market is AAPL, that changed today as momentum in Tech relative to the SPY and yesterday is fading.

 Financials came in to rotation today to take up the slack for tech for the moment.

In today's sector rotation it is clear Financials came in to rotation while tech is falling out.

Here's the latest ES chart..

The negative divergence in ES has halted the market's advance and the market is looking like it wants to roll over.

AAPL/Market Update

 After the initial break in AAPL, it formed another smaller triangle, broke support and popped back above it.

Meanwhile ES has gone negative on the market bounce here. ES 3C signals have been very reliable so lets see what happens.

Put MSFT on your watchlist...

This one looks exceptionally bad.

 At first MSFT doesn't look that bad, RSI is a bit negative and it seems to be in a small top.


 On an hourly chart, the H&S top is a bit more clear, there also looks to be a distribution day at the red arrow on heavy volume.

 The Bollinger Bands are turning lateral and starting to narrow, the short MACD is definitely negative.

 The Trend Channel has held the entire move up, it has just been broken and is starting to turn.

 The hourly chart shows MSFT in line and then a large negative divergence. MSFT is a large golding so it take time to distribute shares without moving the market against institutional positions, they want to sell in to higher prices, not lower ones so they feed a little out at a time. However at this point, the leading negative divergence is so deep, it is lower then where the rally began.


 The same action is confirmed in the 30 min chart.

 At the top, the 5 min chart also shows smart money selling in to strength.

The same on the 2 min chart.

The entry is where it gets tricky. Edwards and McGee (the standard of technical analysis) would say to short MSFT on a break of the neckline or once in a while, there's a bounce back to the neckline that fails and that is a second place to short it. Our experience has been once the neckline breaks (and this is the case with almost all breaks of support on almost all timeframes), there is a sharp bounce/shakeout and many technical traders are stopped out using conventional TA. I look for that volatility bounce and as it starts to turn back down, short it there while it's still rather high, the concept is to short in to strength.

There's one caveat, market direction. If by the time MSFT breaks the neckline the market is in serious decline, having broken the 20 day moving average for the major averages, the chances of the volatility bounce go down as the majority of stocks will follow the market. You might want to set some alerts and you can always check in with me via email as to where we stand, but the 60 min chart looks so bad here, I suspect MSFT is going to see much more downside volatility then it has in years.