Monday, March 24, 2014

Daily Wrap... Bounce or Selling at VWAP?

That is the question...

After this morning's initial smack down of biotech and momo related stocks with XBI (Biotech sector) down -4.04% as a sector and select momos like FB-4.67%, PCLN -3.22%, TSLA -3.85%, NFLX down a whopping 6.67% I thought we'd see a trend change from down to lateral and some accumulation in that range, that did happen, although the accumulation part is pretty much being generous as few charts made it past 2 mins in their positive divergences. Because of the way the action unfolded, my habitual taking of gain in option related position at the first sign of a loss of momentum was put on hold as we need to be able to evolve with the market.

On Friday March 14th when I said I thought we'd see a mini cycle up last week, but unlike every other cycle that has been set up and has been some sort of head fake trap, this would be about accumulating VIX futures or protection to add to the substantial position already in place and would serve as an excellent marker as we transition from the Feb rally stage 3 top to stage 4 decline and more, all of that has happened. We still aren't exactly where I want to be for NEW VXX / UVXY positions, but I do have an open UVXY long that I'm fine with.

So the things we expected to see we have seen. As far as today's action, I assumed we needed to knock the VIX futures down a bit more to finish that accumulation cycle as it looks right on charts like 5 mins...
However isn't quite where I want it to be or where I know it should be on shorter timeframes

As you know, the divergences were enough to move several positions, chief among them are beaten down commodity assets, I moved out of DZZ in the trading portfolio and replaced it with UGLD 3x leveraged long gold, I also opened a JJc / Copper position for a bounce as well and commodities seem to be reflecting that in general including solver which we'll look at closer tomorrow, GDX was not where it needed to be to allocate assets there yet even if probabilities were leaning in its favor...

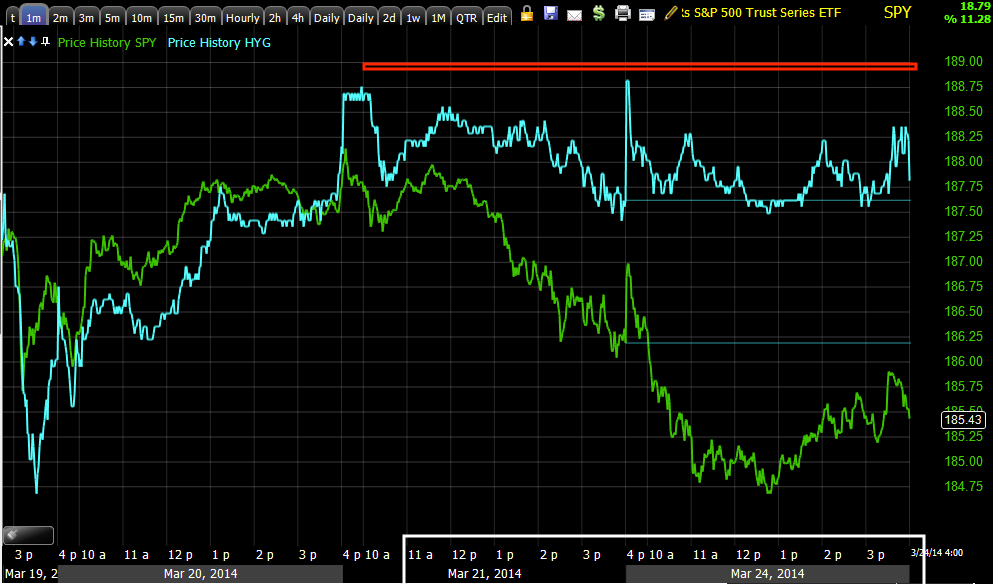
Commodities vs the SPX...
Because of china's cash calls commodities have been under assault, especially copper and iron ore, but even gold even though we've been expecting that for a bit based on signals before the cash calls started coming in after the Chaori default in China. The flat range in commods alone is notable as we know what happens there so I like JJC, I like the UGLD position added today and it seems ther are a few other hints of a bounce, however they are not in leveraged ETFs as we usually see them first, whether it be FAZ/FAS, SPXU/UPRO, TQQQ/SQQQ, URTY/SRTY, etc... the places we normally see them first.

This got me thinking today as you know I felt like at least a short term move of maybe a day or so was in the making, thus the weekly SPY calls, but I checked on something that I was afraid (short term for the SPY call) might be happening.
I looked at ES' VWAP and the divergences seen earlier today moved ES right up to VWAP, this is exactly where middle men would be filling sell and sell short institutional orders so were we seeing steering divergences to get back to VWAP or a small, short term bounce building?

What I know for sure is we ended the day with intraday charts going negative in 1 min timeframes so I wouldn't be surprised to see weakness early tomorrow, the question is do we make a mini "W" and bounce off that in which case I'll add to SPY weekly calls, but that's about it, everything else will be selling short in to any price strength.

There are also a few indications that the market may try to make the bump up that we first expected today on 3C signals, for example...
 High Yield Corp Credit intraday is still in a place that would tell algos to go risk on until the SPX reverts to the short term mean, even though HYG has been and continues to be under heavy distribution since last week's mini cycle essentially ended.

As for the February cycle, HYG is already leading the SPX lower as a leading indicator so keep that in mind as well with the current distribution there.

The VXX (SPX prices are inverted to see the correlation) were a bit weaker in to the close, I don't think it was a ramp so much as the need for VXX to finish accumulating and we'll know that when we see it like the 5 min chart.

Yields are leading the SPY up, but not by much, however this is another very short term indication that what we saw today was correctly interpreted.

 TLT and 30 year Treasuries are the only ones to move since the F_O_M_C, however short term this flight to safety is seeing some distribution so a small move up would fit. The 5 and 10 year T's are still down since the F_O_M_C, the market is still not happy with the policy statement and presser, that wasn't a knee jerk reaction, that was true disappointment in the market. There is a chance as well that the SPY Arb might be activated if TLT and VXX move down and HYG at least holds or moves up, that would be another market manipulation lever.

 The $US Dollar Index reacted in a hawkish manner to the minutes, as I said last week, there appeared to be signs of a leak, this positive in the $USDX appears to be another, but short term it is seeing some distribution here and in the futures so that "could" or normally would support equities in an attempt to move higher which I still think is all about the VIX futures moving lower to finish accumulation.


 As for the USD/JPY carry, the algos seem to be half on, perhaps not all the way there, but the $USDX's longer term signals are looking stronger than normal so the market may very well be stuck on the F_O_M_C and the qualitative vantage.


As for sentiment, it seemed they were buying lows and selling higher prices today, not much there.

I looked at a number of individual assets to get a better feel, I mentioned the leveraged ETFs, in just about everything I looked at, there's nothing sneaking up on us, it is as it appeared in the averages today just about everywhere, the slap down in momos shouldn't be surprising, they've had horrible negatives on long and intermediate 3C charts.

In fact I'm thinking, "What took so long?" The answer of course is trillions of dollars pumped in to the market via POMO and then those assets being leveraged up via carry trades, it takes a while to distribute all of that and it would take much longer to repair the damage so I have no doubt those divergences are accurate and will fire, we just have a lot more money in the market than would normally be the case because of POMO and of course the carry trades leveraging it all up.

As for XLF, it looked better in to the close, but I'm fine with the April Put from Friday which could have been closed today at a double digit gain, I may if things look right tomorrow. XLK put in the same signs as the general market, however AAPL didn't look good on 3C charts, if I had owned it I would have sold it today.

You know what the short term and after situation is with FXP which I'm very happy about so we'll keep that on the radar. IBM is putting in some interesting signals, I have alerts set there as well as a few other places I mentioned today. 

I said last week I thought PCLN needed to break below the 14th's support, it did that clearly today and easily hitting stops so that's one we'll watch for maybe a quick call position if it puts in the reversal process it needs, it did show some positives. 

BIDU looks like it wants to bounce too, as a trend/core short I'm not worried at all, but it would make a nice add to as the position is already at a nice gain or it would make for a nice new entry on a bounce, but I'm not trading around it.

I was really surprised that the 3x leveraged ETFs weren't showing stronger early signals than they were, that's the one concern I have that this may have been more about selling at VWAP as you know distribution started as we hit VWAP in to the close, for example (even though it didn't break the 2 min charts)...
SPY intraday much like sentiment, when it hit VWAP, distribution which I thought was going to make a wider "W" bottom and still may, we'll find out as we approach the area which I think will happen early tomorrow, but the point of the post is, this may have been distribution at VWAP and for no other reason as we are already at the Feb. rally's stage 3 and the mini cycle's stage 3 area, you know what comes next and what we have expected to follow the Feb rally since before it started.

If I see anything in futures I'll let you know, oh, keep an eye on MCP, it's looking interesting, if you're not in it already I'll look around for an entry tomorrow.


GLD/ DZZ/ UGLD Follow Up

Here's the P/L for DZZ which really hasn't gotten too far off the ground yet, but I have a lot of faith in the position when it's time to move back in and the charts.

 Here's the kind of break of support that triggers stops and allows accumulation because the stops are providing supply for institutional traders that are trading on a much larger scale and have to be careful how much they enter at once or they drive price against them and attract predatory HFT platforms that seek to front run their order, plus it's just not good to show your cards in a poker game.

The "almost" Star candlestick on increasing volume is a pretty decent candlestick reversal signal, there's no target associated with it, but it's telling us the trend is likely to change, especially with a gap down and a gap below support levels that are obvious.

This is GLD's 3 min chart, you can see the action today, like I said, I'm not alarmed if I were to hold DZZ, but it's important to know what your trading plan is and trade that plan, a leveraged ETF/ETN in a trading portfolio has the ability to make money rather than just watch draw down, even if you're not concerned with it.

The 5 min chart is probably the most convincing to go ahead and make the switch and that's all it is , a temporary switch.


DZZ itself confirmed, this is a 15 min chart, the gap up alone is enough to take a very close look as the market has been so ruthless about filling gaps.

The 5 min chart was more confirmation, taken with GLD's, there's a pretty strong case for a trading position switch.

And intraday we saw the same thing in DZZ, so this just made sense, especially after the beating gold has taken recently.

Closing DZZ (long) opening UGLD (long)

This is in the trading portfolio, might as well trade. I'm closing the DZZ (2x short GLD) position and replacing it short term with UGLD 3x long Gold ETN.

As I showed earlier, I expect this to be a counter trend bounce in GLD, I fully expect the larger trend to continue lower and as soon as the bounce is done, I'll be back in DZZ long.

If I were holding DZZ as a trend position I'd probably just leave it, but this is meant to be a trading position so I have enough evidence to make a trade here.

I'll post updated charts, but you saw the moves happening earlier today in the near term.

Market Update

Earlier I said if the SPY pulls back I'll likely add to the weekly calls (in my normal use of options, 2-3x longer than I think I need, that would mean about a 1-day move in the market).

As far as accumulation intraday, EXCEPTIONALLY WEAK. If I were judging by the Q's or Russell 2000 alone, I wouldn't have dared enter a weekly call. Judging by the SPY, it's hard to justify entering anything BUT a weekly call, a monthly doesn't seem to offer the profit potential that a weeekly does, in other words, what we are seeing today, although expected after the initial sell-off, is still very weak.

There's a pullback in 3C and the averages, this may be where I decide to add to the SPY position, I "may" also take gains in assets like Friday's XLF puts if there's better reason to do so and re-enter them at more favorable prices, we're not there yet.

 This is about the extent of any accumulation, a 2 min chart leading which may look impressive, but it's really not that much.

Intraday we see the 1 min negative in to the late afternoon, this may create the pullback or lower low that I mentioned in considering adding to the SPY weekly call position as well as potentially taking some put gains off the table.

I suspect that this will pullback and add a bit more as it was a fairly small area, but it needs to be watched as a 1-2 min divergence only can often be just enough to support a consolidation such as we have seen today and can sometimes not mean anything beyond holding the market in that consolidation until the 1-2 min fail.

And as you can see, there's nothing beyond 3 mins and this is as good as it gets, the Q's and IWM are much worse looking.

We do have additional divergences in individual assets, gold, GDX, etc so I think there's some movement, it may be just enough to hit BTC stops on new shorts entering this morning.


Financials

I've been going back and forth between what has worked for me with options and what I think may be necessary to take advantage of some disproportionate, extraordinary gains. I could have closed out Friday's XLF Puts today for a 20+% gain for a day's exposure and normally that's exactly what I'd do at the first sign of a change in momentum, even if only a counter trend bounce, however there are bigger things at play, the February rally's top is dead and this last week's cycle was a timing trigger in that, fear is stronger than greed and markets fall a heck of a lot faster than they climb so having puts in place at the right time can bring some unreal gains.

I decided with only a day in to April contracts to hold them, this doesn't mean that I might not open a position like the SPY weekly calls I just opened that are already at a double digit gain and as you know puts or not, I've already done the work of putting positions in place, I don't need to scramble to chase the market, but rather sit back and cherry pick opportunities.

On that note, Financials specifically (XLF) and some of the Core shorts like GS or JPM are looking very interesting. I want to give you a feel so when we take action you know why we are.

First lets start with the Financial sector (XLF), again I held Friday's puts that were opened.
*Don't be afraid to substitute FAZ (long) for XLF puts, this is not a specific thing, incorporate the ideas and concepts in to your trading style and the assets you prefer to trade, just because I chose puts doesn't mean FAZ or SKF long won't work or even XLF short if you don't like the leverage. The idea I try to pass along are the broad strokes, the concepts, the timing, specific assets, position size, etc is what you are comfortable with. I'm never so happy as when I hear a member made 300% on a weekly option because I had decided to go with a monthly, they took some more risk and really it was just the 3C signals that gave us the timing, the asset and how it was managed and the resulting gain were the trader's own style. That's all I want is to help you add an edge to your style, not create a cult guru following, we're all students of the market and if it works for you, keep it up. I just had to say that so you know what I'm trying to pass along is information, concepts and an edge, not strict trades that have to be adhered to like some other services that want you totally dependent on them for everything you do, I want you to succeed-however you are comfortable doing that.


 This is the 60 min XLF, showing accumulation for the Feb rally and distribution since, price is moving up in to distribution and that's why we call it a divergence, that's our edge or one of them, knowing what is really happening behind price moves and how stable they are.

Closer to home on a 5 min chart, see the little H&S like top? To be a valid H&S top there are strict volume principles that must be met, most traders don't know and don't care, if it looks like an H&S, it's an H&S and I've seen 6 months of shorts burned in 2010 because they didn't do the very simple volume analysis to confirm a H&S which it wasn't.

Right now, because of the concepts and the size of the top, it doesn't matter much, what matters is that traders take the bait and short the break below this mini H&S's neckline, that sets up a small bear trap/short squeeze and sets up some nice shorts for us at better levels with less risk.


This is what has happened in XLF on a 2 min chart since the break below neckline support. Shorts entered on that today, stops are just above the neckline and they are going to be shaken out, that's what 3C is showing us, so why not take the gains in XLF puts? Because this is a short term move, it's a little trap that allows the set up of short positions at better prices because in institutional terms, this top area is not big enough to fill their orders.

This is the 1 min XLF top, you see distribution at the head, a break under the neckline and accumulation which is easy because the retail short sellers are selling to enter the position, that means the institutional buyers setting the bear trap have supply to absorb on the cheap, it serves their purpose perfectly. However don't forget the longer term trends , those are the highest probabilities and the direction I want to be positioned by this point in the game.


This will lead to a lot of other individual assets setting up too, there are different circumstances, but you know what retail looks at, here are two different set ups (short) in financial stocks.

GS
 This is GS's 60 min chart, it's clear what the trend here has been and where the probabilities are, that doesn't mean you have a specific entry on a chart this long, but you know which way you want to be positioned which is short, that means using any price strength to do that enhances your gains and lowers your risk.

This is the 2 min GS chart, notice it's doing the same as XLF in the same timeframe of the Financial heavy SPX?

So this is one I want to short or add to on a pop higher because I'm not chasing it after it has already taken losses when a little patience gives me a much better entry.

JPM... This is a good short, but different circumstance, just remember the concepts, remember what technical traders see, how they react to it and how Wall St. uses that against them as do we.

 JPM's 30 min distribution, we know where the trend is and which way we want to be positioned in JPM, but this is not the same as GS which is chasing weakness which we don't do.

The white box is the Jan/early Feb. accumulation for the Feb rally/cycle and you see what 3C looks like since, the same as the averages and almost all assets.

On the short term 5 min JPM we have price near highs and we could short it here, but if we know financials are likely to see even a 1-day or half a day pop, why enter now? We know JPM is more than likely going to move with the market and the Industry group, why take a sub-par entry when a better one will be available?

Look at the price pattern with the orange trendline as resistance, what do you see? I see a small ascending (Bullish) triangle, traders love these and they'll buy them, so a pop in financials=a breakout in JPM, that's a head fake move and as long as I can confirm, that's when and where I want to enter JPM short, above resistance.

Market Update, SPY Follow Up

Since this morning's momo/biotech sell-off, it has looked like we'd see a trend reversal, there are 3 trends, up, down and sideways and we transitioned from down to sideways, that's typical of short term accumulation and we have that in place as well so it looks like another transition to up is on the way, don't panic, this isn't up as it anything beyond a shakeout as so many clear levels of support were broken today, Retail traders live by confirmation, they won't usually enter anything without price confirmation and being price is so deceiving and misleading, they are often entering at the exact wrong place right in the middle of a bull or bear trap and this is just because they adhere to principals that are over a century old, they are predictable and they are easy marks.

I chose the SPY for a weekly option which is a VERY short duration position for me as you might know, I usually like to have at least 2-3x more time than I think I need, that should tell you something about my views on a counter trend bounce, VERY WEAK and the only way I see there being enough leverage to make it worthwhile is to use weeklies and that also tells you something about my expectations for the duration of a counter trend bounce, VERY SHORT TERM.

Note the large difference between the SPY charts and the QQQ/IWM, you'll understand why I chose the SPY, even though IWM has been one of my favorite targets.

 SPY 1 min, note the lateral trend today we expected this morning as the market was selling off.

Lateral trends are also where we find a lot of underlying action like the small term accumulation intraday for a bounce.

This 2 min SPY leading positive is what made up my mind, the SPY Call is in no way a hedge or protection, it's simply to add some gains.

"IF" it pulls back to the low end of the white box or below and the divergence improves, I'll add a bit more to the SPY weekly call.

At 3 mins we are going nowhere fast, maybe it joins, but for now this smells like a corrective move to shakeout new retail shorts entering trades today on breaks through obvious support levels.

The Q's don't look anything like the SPY, if they move it will be because the SPY dragged them higher.

The IWM 1 min looks a little better, still not on the level of the SPY.

The 2 min IWM has seen no migration other than reversion to the mean with 3C, it has work to do before I'd even consider a weekly call.

Options Trade Idea: Very Speculative, SPY $185 Weekly Call

It's been a while since I've used weeklies, I'm going to try this week's expiration at $185 for the SPY.

This is speculative in size, although I may add on a pullback intraday, especially at a new low.

Trade Management: GLD, DZZ, GDX, NUGT, DUST

I have to make some decisions so you may be feeling the same, I have nearly a +20% gain in the core DUST long position, this should see a pullback on a short term basis, if it was in the trading tracking portfolio I'd probably take the gains, reposition and re-emter, being it's a longer term core position in that tracking portfolio, it was entered as a longer term position, it still has all the signals of a longer term position and I think I just leave it alone. If I were short GDX via puts, I'd be taking those gains right now.

If you want to get aggressive in trading and have the time and risk appetite, there's a short term NUGT long trade lining up, that's on the DUSt pullback so it's a minor short term trade and that's it. NUGT with 3x leverage (long gold miners) is sufficient leverage to get the job done in my opinion without needing options, again, this is speculative and trading against the longer term trend probabilities, but if you're on the ball, you can make some extra scratch.

As for the GLD short that has been working, we entered DZZ (2x short gold etf), there's a decent gain there, but I don't think it's worth it for me personally to trade around, you'd need a short term leveraged GLD long and for the most part I'm not crazy about the options in leveraged gold positions, although the longs are generally better liquidity than the shorts, it's basically the same exact thing as GDX (gold miners), HOWEVER, GLD looks better for a small counter trend trade, I also think overall it looks better for the longer term trend trade, it has just been hammered and is getting too obvious, too many people on the same side of the boat in a zero sum game doesn't work so they'll shake out GLD and GDX will follow through its correlation.

So to be clear, I'm leaving DUST and DZZ (leveraged ETF shorts on gold miners and gold) in place, but there is a counter trend trade opportunity at hand, just speculative. If the opportunity present and looks worthwhile I "MAY" play an options hedge just for some extra gains, they are not  positions (DUST long and DZZ long) I'm truly worried about hedging.


This is all really part of what's going on broadly in the market as covered in the market updates today.
 This is the bigger play in GLD, the reason the DZZ position exists, as you know I think GLD pulls back to the lower end of it's base around $115, I want to ride DZZ to that area. Once we are there I expect Gold is going to start looking like a long term bullish play and will look for a new entry there for that trade, but one thing at a time.

The 3C 30 min chart above suggests GLD will continue to trend lower despite some short term noise that is meant to knock all the clingers on, off.


 5 min GLD is where I see the DZZ trade pulling back a bit and GLD bouncing a bit, it has become too obvious of a short and retail needs to be swept off the trade and run out (stopped out), so this 5 min positive on a gap down is looking like the area if you are interested in a short term trading play long Gold, just know it is short term in my view and speculative.

 GLD 15 min shows it should be a bounce worth trading, but again that's up to you, the larger negative divegrence is what I'm more focussed on.

 DZZ which is my play on GLD short (2x short Gold) has gapped up and in to a 3 min negative, this is high probability pullback, I can sit through it though, this is not an options position and there's no time decay that concerns me as it would with an options position, this is why I chose a leveraged ETF over options, to give me time in the position without constantly reacting to every little counter trend oversold/overbought move, just sticking with the trend.

The 60 min DZZ positive is confirmation of the 30 min negative in GLD and tells me DZZ has a lot more upside and is a very attractive position, if you like it, then a pullback is your opportunity to get involved.

GDX
 As for gold miners, they are pretty correlated to gold, not as much as in the past, but from what I see they look very similar right now. Just like the longer term 30 min negative in GLD, GDX has a 60 min negative, this is why I have DUST (3x short GDX/gold miners) as a core/trend position.

Everything still looks good for that position as long as I'm trading my plan.


Like GLD, the short term intraday chart (1 min) is showing a positive divegrence meaning a NUGT/GDX bounce and a pullback in DZZ, but it's a corrective move, not anything I'm concerned about, you could still trade it if you wanted to.

NUGT is basically a 3x leveraged ETF of GDX, this shows confirmation on the 30 min chart of the same negatives in GLD and GDX so as far as longer term trend, everything is still good.

On the 5 min chart though, you can see the small positive building, this WILL bounce, whether you want to trade it and trade around DUST is up to you, the time you have, consider the transaction costs, etc.

 Finally DUST (which is the 3x short ETF of GDX/gold miners or the opposite of NUGT) which is the core/trend long I'm leaving open for now is confirming all of the above, the intraday chart shows a pullback is likely meaning a GLD, GDX, NUGT bounce.

However, my reason for picking DZZ was to be able to have leverage to ride a trend, but not so much that I have to react to every counter trend correction.
The 60 min DUST chart has a fantastic leading positive and large base, this is why I'll stick with it as a trend trade.

This is why trading NUGT long is a short term speculative position because this is where the probabilities are even though you can make NUGT work, you just have to understand it's a corrective trade, not a trend change.

If I decide to do anything it will probably be with options and just to take advantage of the signals and add gains, but as I said before, you don't need that much leverage if you want to trade the corrective move, a 2x long Gold ETF will work or 3x long Gold miners like NUGT will work, just remember they are corrective trades, not trend trades.


Market Update

We're still heading in the right direction for set ups and for the market to crack, the SPY is definitely the leader, QQQ and IWM do not look good and this is why I keep coming back to the IWM for hit and run short or Put positions.

As far as what we have now, earlier I thought we'd see lateral movement once the momo stocks were done selling off and that has happened, that's a small intraday reversal process building, at least in the SPY which should float the other two along with it, although relative performance may be much different.

HYG is still getting pounded with distribution, it's days (the last week+) as a market levitation lever are done, smart money is done with it.

Of course the VXX is doing exactly what we thought on Friday the 14th, it's not quite where I want it as far as opening something time sensitive like a call, but overall I'm happy holding UVXY equity long (2x leverage VXX).

 SPY downside confirmation, then revversion to the mean this morning leading to this lateral movement which is indicative of some small accumulation by the price action alone, we can easily see it on 3C, but this isn't anything big, it's a 2 min chart, but a far, far sight better than QQQ and IWM right now.

So this is the bounce that helps us enter shorts , sell, etc, but unless you are going to trade the bounce which is counter probabilities and not something I'm interested in unless things change a whole lot more, I'd just continue to be patient, let the game come to you.

IWM is not looking nearly as good as the SPY this morning.

Q's look even worse, without the SPY, these might not be able to bounce at all, that should tell you where we are in the minor mini cycle which is attached to the end of the Feb rally's top.

HYG continues to see distribution, they are moving out, it's no longer a viable lever so the cycles are getting ready to switch.

VXX 1 min intraday is reflecting minor softness, which it should with the SPY looking the way it does right now, that's fine, that's good and just makes VXX / UVXY all the more attractive on a pullback intraday or so.

This is the purpose of the mini cycle we spotted on the 14th, unlike most cycles set up that are about a head fake in the averages, this has been about nothing but accumulating protection on the cheap, this 5 min chart is the evidence. When I see 1, 2, 3, and other charts beyond 5 min flying like this, that's when I know I can entertain a VXX call or an add to or new position in VXX or UVXY long equity positions for a swing PLUS trade, really PLUS.

So far things are going great, they require a little patience, but that's the name of the game, let them come to you.