Tuesday, August 5, 2014

Daily Wrap

All things considered, today looks a lot more like the "W" bottom (with a head fake move below hitting stops and drawing in new shorts which are accumulated and squeezed) I was looking for.

Breadth declined across the board with only 20% of NYSE stocks above their 40-day moving average which is as bad as it gets in a full-on bear market. In fact breadth deteriorated everywhere today, many indicators making new 2014 lows like the NASDAQ Composite's Advance/Decline line, however nowhere near as sharp as the decline from Thursday in which breadth fell by a huge margin after an already huge decline Wednesday, today was much more moderate and in line with normal expectations for a day like today closing solidly red  with the Dow now negative on the year, that really only took about 6-days which is why I keep my core shorts in place.

Nine of nine S&P sectors closed red, of the 239 Morningstar groups I track, only 32 closed green. 

All of this spells the same oversold breadth conditions that we saw on the first part of the "W" base, assuming it holds, that's what we saw again today making the market quite oversold and in a larger context, in a lot more trouble than most people probably realize, even the bears.

While the Dominant Price/Volume Relationship was Close Down/Volume Down which is really of no significance, many of the averages closed on heavy volume, especially the last 2.5 hours of the day which happens to be the same area we saw a lot of intraday positive divergences put in across a number of asset types. I suspect that our "W" bottom base is at the beginning of the end of its creation, again... assuming it can hold with the major macro wildcard being geo-political as Poland (who's desperate to get NATO action re: Russia) used the "Invasion" word today, that appears to be the area we saw the most 3C positive divergences/accumulation which is what we'd expect to see on a "W" bottom with a head fake.

Here's a quick chart tour of the afternoon divergences that look like we may have just finished up the "W" base...

 XLF 1 min

XLK 1 min

QQQ 1 min

DIA 1 min

VXX 1 min negative

UPRO 1 min

AMZN 1min

GOOG 1 min

JPM 1 min

Z 1 min

NASDAQ Futures (NQ) 1 min

Between the heavier volume on the day, the breadth of the market being very oversold, the "W" base forming as expected with a head fake move below Friday's lows (as expected) and these building divergences, I suspect we are finished with the base, however, I probably won't be entering any more long/bounce positions and I won't be closing any core shorts, this market is in too much trouble to miss that ride.

This is nowhere near the prettiest divergence I've seen and honestly even having a little long exposure here is a bit scary although my short exposure dwarfs it, but I think it's probably enough to get the job done.

 QQQ 15 min with the "W" shaped base starting at the white trendline. Today would be the second low in the "W" and the next move would be to the upside completing the "W",

SPY 15 min positive

DIA 15 min positive.

Just remember what the highest probability resolution is if breadth hasn't al;ready given that away....
Not only has the Dow popped out of the bearish ascending wedge and erased all of 2014's gains (in about 6 days), but is at the worst divegrence I've seen and I've looked at a lot of historical markets.

Market Update-Intraday Lows...

First I want to show you the furthest out we have confirmation for a bounce using the SPY 3C signals and derivative ETFs which (as we've seen in the SPY before and in GDX now) will move independently of each other even though price tracks the same, volume doesn't.

 SPY 15 min leading positive, yet this is still not a big base so I wouldn't be too impressed by the 15 min chart, I would say considering the timeframe and the size of the base, it's along the lines of what was expected for this week in Friday's "Week Ahead" post.

The 3x long SPY, UPRO has the same negative and positive 15 min signals. SPXU, the 3x short SPY should have the opposite of the two above for confirmation.

And SPXU has a leading negative 15 min.

Intraday it looks like the Q's are the first to find an intraday bottom and probably the start of the end of the base process.

QQQ 1 min intraday.

I suspect the Russian / Ukraine (which are probably the most important macro events of the week being a lighter economic data week) nervousness which sent Gold higher and stocks lower has been used to accumulate the second part of the "W" base.

I'm leaving the current positions in place, but I don't think I'll add anymore long exposure beyond the IWM calls, the XLF calls and GDX calls (UNG is a separate matter). I'm leaving all of the core short positions in place as well, they should have plenty of hedge if this is the end of the base process.


GDX Update

Last week we entered some GDX 8/8 $27.50 calls, Trade Idea (Speculative Very Short Term) GDX Calls , as it says, on a speculative basis as the signals in Gold miners have been hard to get god confirmation which makes sense looking back on the trading character over the same period.

However it looked like GDX would see at least a short term move up, the longer term has been difficult as we had expected a pullback some time ago, but assets can consolidate through price (pullback) or through time, but for now this is what we had in front of us.

GDX just took off intraday on a pretty decent move or start.

 GDX 1 min since Friday's odd close.

GDX this afternoon...

The 3 min chart's trend has remained ...

 as the 5 min chart has looked even better moving forward since noon yesterday and especially today.

This divergence goes out to a shallow 15 min which is why I prefer an asset with some leverage, for a NUGT long trade I'd like to see a stronger looking 15 min chart that can support a larger move to the upside.

XLF / FAS / FAZ

One of the areas I was most concerned about last week (Friday) for a market bounce was financials which is why I decided to close the FAZ long position (3x short Financials), Closing FAZ Long however I didn't enter any Financial long trades like FAS long (3x long Financials) or XLF calls because it was about protecting the position at the time and then seeing if there was something strong enough to warrant taking on a long position or just waiting it out to re-open the FAZ long.

XLF has built the stronger "W" base and in addition has run stops with volume increasing just a mere penny below Friday's intraday lows (stops under short term support and shorts entering on a break of short term support). These kinds of head fake moves are what give reversals momentum and reduce premiums in options which is why I often like to use them for entries (especially for options) as long as we have good confirmation.

I have thought the market would bounce this week, I just thought it needed a stronger base and as breadth revealed yesterday, that wasn't the bounce we were looking for as breadth barely moved.

Here's XLF , FAS and FAZ...

XLF creating a wider "W" base with a head-fake (stop-run) move.

Volume surged intraday just a penny below Friday's intraday lows.

This is the 1 min chart since Friday with a stronger positive divegrence now as I'd expect to see on building a larger base.

The 2 min chart is leading positive today in to lower prices in XLF

Ultimately we have about a 15 min positive (leading) divergence, this still is not a huge base and that's why I prefer the leverage of options while keeping the position size speculative again for the same reason, this is still not a very big base.

As for the FAZ long closed Friday, Closing FAZ Long, FAZ is showing confirmation as are most of the inverse ETFs like SRTY (short term).

FAZ seeing intraday distribution on a move higher.

FAZ 5 min negative divergence was definitely worth closing the partial FAZ long with the intention of adding back a full size position as a bounce nears the end and moves to a downside reversal process.

The big picture probabilities for FAZ are represented on this 60 min chart with a huge leading positive divegrence, none of the recent shorter term negative divergences have even touched this chart which tells us any bounce here is not a game changer, just an oversold correction.

FAS-3x long Financials
Much like XLF and inversely like FAZ, FAS is leading positive in to lower prices which is the confirmation I'm looking for.

FAS's 10 min leading positive at the "W" base and a head fake move.

Ultimately though on a 60 min chart, like XLF or inversely, FAZ, the big picture probabilities are still very firmly anchored to the downside, that doesn't mean we can't hitch-hike a ride up  before entering or adding to shorts we like.

Trade Idea: (Short Term) XLF / FAS

XLF has done what I wanted to see, a wider "W" base as well as a head fake move under Friday's intraday lows. I'll post al of the charts next, but for now I'm going to enter a speculative size August 16th XLF $22 call position. For those who prefer not trade options, but would still like a little leverage, there are the two ETFs,  UYG 2x long Financials and FAS 3x long Financials.

DIA is putting in the best base building so far...

I suspect that has to do with the fact the DIA is closest to the intraday lows from 8/1, actually just went a bit below, this is more of the stable base I have been talking about since Friday afternoon and yesterday.

Confirmation of a positive divegrence in to the lower prices that build the base is the most important part.

So far the DIA looks the best and I suspect for the reason stated above.
 DIA showing positive divergences at dips in price intraday

 DIA 3 min chart leading positive intraday at lower prices...

DIA 5 min is by far the best looking and the only average showing this kind of base building improvement thus far.

Looking at short positions like SRTY, they look very much like a market bounce is coming and this is why I opened the IWM calls last week as a hedge.

The 15 min chart has a large positive divegrence that can take the IWM a lot further, but right now there's a smaller negative that's in line with a typical pullback you'd see in a normal uptrend (our market bounce).

Since this is one of my larger short positions I don't want to close it or close it and perhaps add URTY (3x long IWM) without very good reason.

 The  SRTY 3 min chart shows more detail and the divergence at the highs looks much sharper as it should, however...

When considering what this position is (a position trade), the probabilities beyond a market bounce are solidly in favor of lower prices in the market, thus it's very difficult to close this position without very good reason and thus far I don't see very good reason beyond the calls in place already.

I suspect we will see stronger charts by the end of the day, whether strong enough to enter additional bounce trades or not, that's the question.

Market Update

Patience is the only game right now. As mentioned earlier we have a larger base pattern forming which required the market to pull back a bit as accumulation doesn't occur in chasing higher prices, but accumulating lower ones.

There are a few things I'm waiting to see before I decide whether or not to add any short term long, "Bounce" plays, I had mentioned FAS as a possibility. Here's what we have and what I'll be looking for either way. I think on the next IWM move I'll likely close the Aug 8th $110.50 calls and if I still like the idea of an IWM bounce, open up some longer dated expiration calls.


 This is the highest probability "short term" chart, 15 min leading positive SPY, so this suggests the bounce we were looking for this week after a broader base had been created which appears to be what's going on now.

This 5 min SPY chart has a positive divegrence and has a negative divegrence most recently which is creating the larger base, but this chart will have to show a positive divegrence in to the price pullback for me to enter any bounce longs.

This is a rough picture of the small inverted H&S-like base, the main point being its wider than what we had yesterday which really could not support much of a move, note how the IWM looked the best earlier as it had a stronger base as of this morning than any of the other averages as covered last night.

The SPY 1 min is still in line, this is the first place I'd expect to see accumulation of lower prices, the market "can" bounce without accumulation, it's just not a bounce I'd want to be involved with on the long side at all.

The 2 min chart is in line as well, it would almost certainly need the 1 min to go positive first and then migrate to this timeframe and ultimately at least to the 5 min chart , turning that back to a clear positive before I'd consider any bounce longs, otherwise I'll just leave core short positions in place and look to add to them when the opportunity is there.

So for now, in my view the best thing to do, the only thing to do is to be patient and see what message the market sends us and whether it's one worth acting on short term. For now, there's not a whole lot to do.

HLF (Long Term) Position Trade Follow Up / Set-Up

Who knows, maybe Ackman is right and HLF is going to zero as an Enron-like scam as he calls it, in any case we didn't enter HLF because of Ackman and we didn't shy away from it because of Icahn and their feud, it was all based on the charts and the concepts, especially relating to where we enter H&S tops and where we don't.

Right now the HLF equity short is at a +22% gain and really has barely broken the H&S top. I suspect in the days ahead there will be an attempt to fill some of the gap which is not my favorite entry, but I do like the short a lot and that makes it an entry worth considering for a longer term position trade.

 This is the daily chart of the H&S top, they almost never look like the textbook in real life, this is one of the reasons volume confirmation is so important. Even the ones like the SPX 2010 price pattern that looked much more textbook was just random price action with no volume confirmation and a lot of traders were burnt shorting it.

As always, these are the 3 areas I'll short a H&S top and the one I won't, the head, the right shoulder, never on the break of the neckline and then after the new shorts who entered on the break of the neckline are shaken out which is where we added to the HLF partial position short on July 22nd as it was up +25.45 %,, Adding 25% to HLF Short Position, which wasn't an easy short trade to make emotionally, but the charts showed us it was the right place and time to make it.


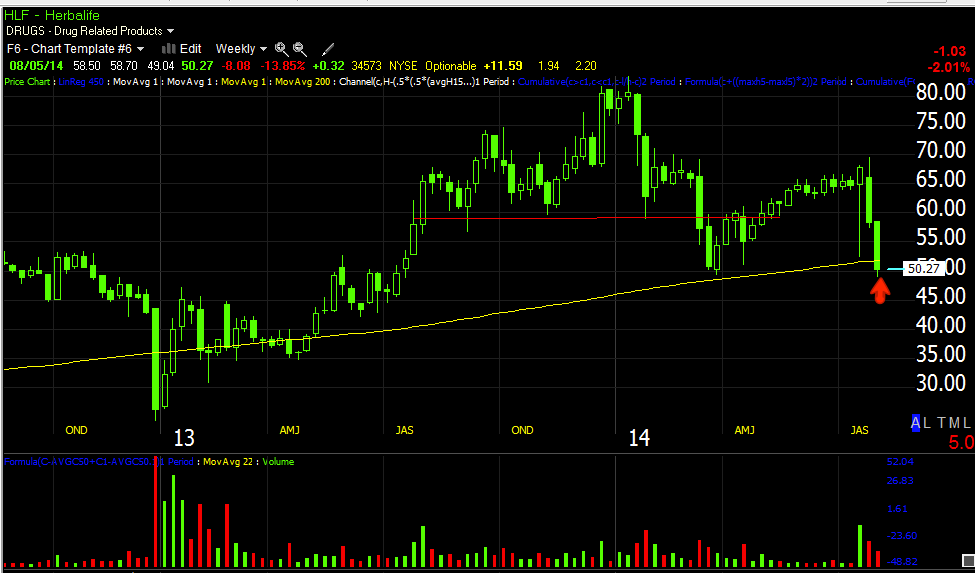
 This is the 200-day on a 5-day chart, an area of natural support and thus a likely area for HLF to bounce a bit and open up another opportunity to either start a new position or add to an existing one. I saved about 25% space in the risk management / position sizing to add a final 25% size position to fill out HLF and will likely do so on any bounce, if there's no bounce, I'll consider adding at a later date on a counter-trend rally as pyramiding up a true short position is actually a smart idea and a way in which you can make more than 100% on a short (one of the old arguments against short selling, that a stock can only go to zero and thus you can't make more than 100%, but you actually can...Making More Than 100% on a Short.

 This is the daily 3C chart, it actually looks the worst at the short shakeout or the last place I'll short a H&S top.  We've talked about this conceptually numerous times, but this is a chart that is giving us a real world example as the market starts to really come apart and these right shoulders and top patterns are breaking.

 This is my 60 min Trend Channel which I'm just using to illustrate the slight change in character as the ROC in price is changing and starting to move more laterally, likely to build a small base from which it can bounce and thus provide another entry for those interested in HLF. I think I'm going to try to add to HLF if possible, but otherwise just let this position work and not fool around with it (overtrading) too much.

This 15 min chart of HLF shows the negative divegrence at the top of the shakeout or area #3 and the Ackman presentation rally in which HLF put in its largest 1-day gain which as I said that day, I believe was likely Icahn trying to humiliate Ackman on his big day as we saw a 5 min positive divergence, enough to make a move like the 1-day move we saw, but not enough to do much more than that.

You can see overall HLF is in leading negative position which is good, but as price starts to lose some downside momentum there's a small 15 min positive starting to build.

If you are interested in a longer term position you can just put aside and let it work for you without worrying about trading around sharp corrections, I think HLF is a great choice and who knows, maybe the company will be proven a scam and go to zero.

As always, if interested, I'd set price alerts above this area and near the gap area as I suspect we will see some bounce sooner than later, although I doubt (from what I see right now) that we'll be above the neckline again.