Monday, April 11, 2011

EARNINGS ARE A BLAST!

AA just kicked off earnings season and if you just looked at the headlines, you'd think they beat with "Record this and that" or "best since xyz", the fact is they missed on several crucial numbers: $100 million dollar miss to revenue, EBITDA of $955 million misses by $60 million, Cap-ex of $204 mm is below consensus of $475m.

Other then that, everything is rosy and I just can't seem to follow the AH trade as it first seemed to be halted, then Yahoo showed AA trading up in AH and now from what I see on my screen, they are trading down significantly around $17.15 (down about -3.2%).

Here are the 3C charts, which are largely negative, there's one chart that kept me from calling this  short earnings play, the 15 min, which I don't know if it's an anomaly or caught between a couple of cycles. Please do refer to the previous chart I posted asking and showing some evidence of a possible major top in AA.

So far the market is down a bit in AH, but has largely taken this miss in stride.

 The bid/ask in blue at the right around the $17.20 area currently.

 The hourly 3C chart is crushingly horrid. Note the final divergence on a false breakout play (again, this is a sign of the times, the market does this so often that it's nearly predictable 85% of the time).

 The 30 min chart, not looking good either.

 Here's the monkey wrench-the 15 min chart, if it were not for this chart, I'd have called a short earnings play on AA.

 The 5 min and 1 min below are pretty much in line with price and insignificant.


So, we'll see what the market thinks of guidance in the days to come (it usually takes a few days for all the games to pass and to get a true feel for what AA will be doing). This is not a great start for the earnings season, but it's one company so we can't read too much into it by itself.

It looks like AA Missed and is Halted in AH trading

AA Earnings

A possible top?

I'll get the 3C charts out soon, long term charts are negative. Short term charts are more or less in line, the mid terms are a bit questionable, otherwise I'd say AA is not going to have a good report.

USO-On Track

Since last night I've posted two times on USO

Last Night

Pre-Market Today

Here were the initial pullback levels for USO

And as hard as it might be to imagine right now, the deep pullback...
This would be hard to imagine, but right now oil traders have a great opportunity to accumulate at lower prices, the opportunity doesn't come around often and they are sure to take advantage of it, we just want to be in the same place at the same time.

Other then some very short term positive divergence on the 1 min chart, which amounts to the normal intraday jiggles, there's not much sign of accumulation yet, so I'm expecting this pullback in oil to be a bit ugly, in fact wen it's done, you may look at the chart and think twice about buying USO. However, that is why I want to remind you now that their goal is going to be to shakeout as many traders as possible (we've already seen a drop of 3.25% today on rising volume-traders are getting spooked already. The point is however, the pullback may be very ugly when all is said and done, it may be even further then my most extreme guess,  this is typical for the market (huge overreactions). For all of you who like USO and believe oil is going higher, you have to separate the strategic (what the evidence has shown us about oil's near to mid-term future) from the tactical ( which is likely to be ugly and emotional).  As Baron Rothschild said in the eighteenth century, "The time to buy is when there's blood in the streets", metaphorically speaking, although in oil's case, it probably can be taken somewhat literally.

Market Post

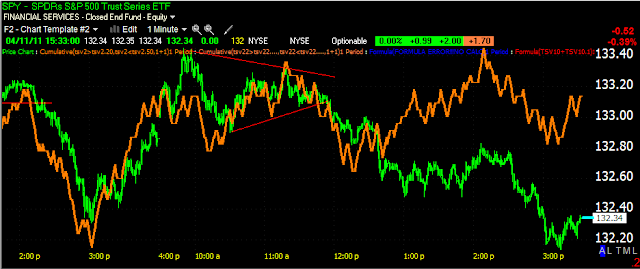
Here's the SPY

 The 3C / price action looks a lot like confirmation....

That is until you back the chart out, there's still a relative positive divergence. I am curious about it with AA kicking off earnings season tonight. Perhaps we'll see a run into the close that will explain it, otherwise, I'd expect a gap up in the a.m. which would be curious, especially if AA reported good earnings.

The TICK chart vs the SPY (white) is interesting, especially the last hour as TICK moves up while SPY has been moving down. I'd guess that we'll see some buying into the close.

TZA Follow Up

Last Thursday I featured TZA (long)

TZA is up nearly 7% in the approximately 2 trading days since. TZA is a leveraged, Ultrashort ETF on small cap stocks. Please see the linked post above for more details on the trade, however, if you are interested in the trade, it has several zones of resistance coming up which may offer a pullback and a good risk/reward opportunity to get involved.

 So far TZA has had nearly perfect confirmation, so it's off to a good start.

On a daily chart, here are a couple of zones of resistance where it's likely a pullback/consolidation may take place, just under $38 looks to be the more likely of the two.

You may want to set an alert to let you know if a pullback has taken place, you can use www.FreeStockCharts.com to set alerts and get real time charts with no 20-minute delay.

EDZ-Leveraged Short on Emerging Markets

I've talked about EM and the many reasons I think a short on these emerging markets will make sense. I won't  get into all of it again, but I will tell you what I've discussed with members via email re: EEM (long emerging markets ETF). Six months or so ago, EM was all the rage, I can imagine portfolio managers talking their clients into EM portfolios, since then EMs have aggressively defended the Fed's main export to them... inflation which diminishes the EM trade.

However, EM trades were strong into the end of Q1 and it was somewhat logical to me. Q2 prospectuses and Q1 reports come out after the end of Q1 (March 31st), therefore it was very important to many funds that talked up EMs for them to perform well into the end of the quarter. However, I believe fund managers know the problems associated with emerging markets and I believe they are rethinking the trade. However, if you were paying 20-40% of your gains to a hedge fund manager, you expect performance and if you were aggressively pitched emerging markets 6 months ago, it wouldn't look very good for the fund managers to have sold them shortly after selling you on them. What I mentioned over and over again was this, "What a fund manager wants in their portfolio and what they must have in their portfolio are not always the same, thus once Q1 is over, they are free to sell EMs aggressively, it won't be reported for another 3 months and in that timeframe, should EMS fall significantly for fundamental reasons and because the herd is moving out of them, then it's easier to break that to your clients without seeming wishy-washy (pitching EM and selling them the same quater would seem wishy-washy). So I told members to watch EEM/EDZ right after Q1 ended through April. Interestingly, it looks like this may be what's going on.

Take a look at EDZ which is the leveraged short ETF on emerging markets and also note the dates.

 EDZ (short EM) starting lateral movement from a steep fall around April 1st

 60 min 3C positive divergence starting April 1st

 EDZ 30 min and TSV 55 (long term)going positive into April

 10 min 3C and price appreciation in EDZ in early April

 5 min positive EDZ divergence

 Here's a 1 min chart suggesting a possible slight pullback in EDZ (which would be welcome if you were interested in buying EDZ)

My X-over screen on a 60 min. chart, the possible pullback area would be to one of the two moving averages.

Now compare to the Bullish Emerging Market's ETF-EEM
 a 60 min negative divergence starting around April 1st.

 30 min 3C negative divergence in the same time period.

 10 min negative divergence and price falling.


And the same X-over system showing nearly the exact opposite signal.

For me, the theory seems to be working out, I like the idea of shorting emerging markets, if you are interested in the trade, you may want to phase into it or wait for a pullback for a better entry.

DRYS

This may be a short trade worth looking into if we get the proper set up.

Here's the Baltic Dry Shipping Rates, normally it's quite volatile, however this index has been falling for quite some time which is in itself an indication of global shipping demand of dry goods. Even if we consider there are more dry ships available and attribute the fall in prices to that, it's still not good for a shipping company. If we add the increased cost of fuel, it's even worse. This is a sector that could be a prime candidate for a margin squeeze.

 Here's DRYS' daily chart, which shows it has broken below a top and while moving somewhat laterally, has been making some lower lows. The current price placement compared to a few weeks ago could set this up for a nice false breakout/reversal to the downside which could decisively break that lower trendline.

 Here's the distribution on the first test of resistance (far left), then distribution a few weeks ago and apparent distribution on this bounce.

 This 1 min chart is showing a minor positive divergence developing which could be the key to the trade's setup.

 If we can get a move into or above the white rectangle, it's highly likely it would be a false move and an excellent area to short DRYS with minimal risk.

Here's the long term Trend Chanel, so far, it is in a downtrend.

Remember, there's two possible setups, the outright break of the lower trendline on the daily chart or a false breakout mentioned just above. 

SPY Update

I'm back and the SPY has continued laterally since the last update, the positive divergence continues to build suggesting a bigger move to the upside, the longer it builds in a lateral environment, the bigger the eventual upside move will be. I'm still expecting a move above the apex of the triangle.

Market Update

Here's a market update, I need to run out for about 45 minutes to pick my mother up from a surgery center then I'll be back.


 Basically everything from the last update has come to pass, the triangle continued to develop, note where traders put stops and limit orders-the usual places and volume increased as those were broken.

 As I said, the volatility dropping would cause the Bollingers to squeeze and we'd get a highly directional move-DOWN.

The triangle is too obvious and the initial break (intraday) I doubt will hold, we may see a "Crazy Ivan" with a reversal break to the upside of the triangle's apex.
There's already 3C indications of positive divergences, like here in the SPY

 Here in the DIA

And a strong one in the Q's. 

Another possibility would be a kiss goodbye to the apex, but again, that is what trader's would expect, so I doubt that will be the final move, I lean more toward the upside shakeout. After that we'll see what happens. It's likely the market will close semi-flat going into AA's earnings tonight.

Be back in about 45 minutes.

AAPL

We watch AAPL a lot, whether trading it or just because it has so much influence on the market. AAPL is now heading toward a crucial inflection point as earnings season kicks off tonight with AA.

 Linear Regression shows a well defined downtrend in AAPL for most of the year, note how it's headed for the lower channel and possibly the 3rd major lower low putting AAPL into a possible primary downtrend.

 The daily chart was pretty unambiguous about the distribution into the top, what's perhaps more striking is the current leading negative divergence in both 3C and Money Stream.

 On the 60 min chart, note how sharp the reversals in AAPL were.

 The 30 min chart confirms the 60 minute with a little more detail.

 On the 15 min chart we see the tricks of the market, each negative divergence/reversal happened AFTER a false breakout (in the red boxes), again, these false breakouts serve as a primer to get the reversal moving under its own power as longs sell at a loss increasing supply.

The 1 min chart has been very clearly negative, both in 3C and MS, it seems like the bottom channel is a magnet drawing AAPL toward it. What happens there and the severity of any possible moves could have major implications for the NASDAQ 100 and the broader market. I think AAPL is one of the reasons the NASDAQ is underperforming the other averages today.

If you are interested in trading AAPL, I'd wait to see what happens at that bottom channel, a bounce would be a welcomed set up.

LVS Trade (short) Follow Up

This one was from March 1st

LVS made about 15% since it was brought up, then bounced with the market to an area which I would consider to be a "Kiss Goodbye" to the top pattern.

 The March1st Trade idea and the subsequent "Kiss". LVS looks like it's rolling over here which makes for a pretty decent probability trade with good risk/reward characteristics.

 30 min 3C shows negative divergences both at the breakdown from the top and a worse one currently on the bounce as it starts to round over.


 The 15 min chart is also negative in a leading divergence.

On the 1 min there is a positive divergence, I'm not sure how much further it can bounce intraday if at all, but my guess would be to the white trendline, making for a lower risk entry.

Watching Grass Grow

Today's market is mixed and lackluster, it reminds me of the summer doldrums when you couldn't find a trade anywhere as nothing moved. Interestingly, Monday's historically are the biggest gainers of the week and responsible for most to all of the gains for the week. So far this market is like watching grass grow, which always makes me nervous and on alert.

 The Dow is the strongest today, but remains in the lateral range so technically it's doing pretty much nothing.

 The IWM is one of the weaker of the averages, but has managed to find some support at Friday's lows.
Look at the volume on each of these, excruciatingly low.

 The QQQ another weak one, basically having an inside day within the range.

The SPY also is having an inside day with very little going on, some higher prices earlier were rejected and the averages look like they too are in triangle-type consolidations as well; that means that volatility will die off and Bollinger Bands will narrow, that usually leads to a highly directional move, that's why this type of action makes me anxious.