Tuesday, October 11, 2011

Faith-Actually, Having the Guts to Stick by Experience Gathered Over Years

Sometimes it's hard to have faith even in my own indicator, today I showed you a lot of charts and no matter what my mind was telling me, I had to say what I thought, that it looked like the place to be short, even though we still hadn't heard from Slovakia and AA had the potential to send shares rocketing higher and the Euro has been on a rip, everything fundamentally or from a common sense view told me don't do it, but I'm evidence based and even when it's hard, 3C has pulled through for me too many times to doubt it, even if things don't happen like  expected, they generally do happen.

I'm not taking any victory laps though, a lot can and does happen overnight, but so far the evidence doesn't look good for the market. AA sent Asia lower, futures across dozens of markets are in the red.

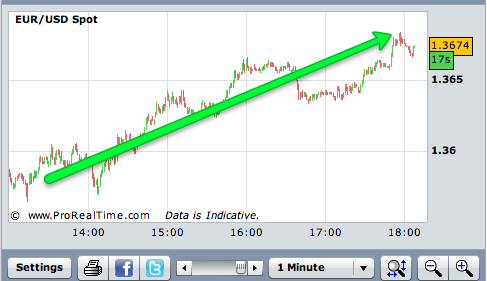
That 2.5 year record rally in the Euro seems to have reversed, it's off the highs from the close as you can see here and remember how I pointed out how the market had diverged from the Euro, a rare event.

 The 3C 5 min ES futures went negative last night and today, sending them lower tonight as you can see.

 The ES 15 min chart fell off a cliff in a leading negative divergence.

 And the hourly continues it's trek down, this is amazing information that is probably being seen by you for the first time, I doubt many others have seen anything like this.

 NUGT has given a long signal-perhaps there's an impending flight to safety in the PM's-Gold?

And the hourly 3C SPY extended hours chart is headed lower, although we still have pre-market to add to this.

The AA charts I posted are being called "Amazing" by some members as they seem to have clearly indicated Wall St. was distributing AA most likely on an earnings leak, perhaps I should have posted it as an earnings play, but like I said, no victory laps yet.

The final nail in the coffin would be an upside head fake, whether the market can muster it or not, ????

It's not needed, but it happens about 85% of the time just before a reversal.

On the other hand, this could have been our head fake..
The 50 has acted as resistance, a prior head fake in late July can be seen to the left that sent the market much lower, MANY technical traders take a cross above the 50-day as a buy signal and it hasn't happened since July so this could be the head fake right here, we'll know if prices drop below the 50 day on increasing volume as trapped bulls scramble to sell as their positions go underwater and margin calls start the snow ball effect that took the SPY from $132.50 to $110 in 9 days. The entire Head fake snowballed and dropped the SPY by 18% from head fake high to the lows-that's the point of a head fake.

Turning points are always times of increased pressure, tonight I'm feeling very relieved and happy that I had faith in my system today and posted what I did about being short here, it wasn't an easy limb to climb out on. So lets see what happens overnight, lets see if the market can muster a final pop and more then anything, lets make some money.

And "Other Things"

Remember what I said about Slovakia, "Bribes and other things"?

Well the government fell over a vote, the sitting government are out on their butts, I'm sure a drop shipment of campaign cash to those out of power who would support the EFSF didn't actually happen, but it might have....

And the good news is we get to do this all over again in a week, although this time the outcome has been predetermined and that's how you roll (or roll-over your opponents) when you sit in the seat of authority.

More....

First Look @ Extended 3C

First of all, everyone here knows I share all of my indicators with members, but please don't ask me about this one yet. There's a lot to learn and putting something out there that I don't fully grasp can be down right dangerous. However, it will be used for all member's benefit.

First here's AA

 AA 15 min 3C

This is 3C 15 min including extended hours which are in the lighter shade. Both show distribution in AA, but the second chart shows a continuous trend of distribution through normal and extended hours.

Now for ES

First of all, what is ES? ES is the S&P 500 futures contract (not options, but futures, the same as cattle, corn, coffee, etc) traded on the Globex 24 hours a day from 5 p.m. Central on Sunday night to 4:30 p.m. Central Friday night; also referred to as "E-Mini" Typically there are over a million contracts traded per day. To figure out the price of 1 contract, multiply the S&P-500 by $50. So as of today's close, 1 contract would be approximately $59,751.50. Multiply that by the typical 1,100,000 contracts traded per day and you get approximately $65,726,650,000-yes, over $65 billion dollars a day traded.

Compare that with the 192,400,200 shares of the SPY traded today at the closing price, you get $23,020,683,930. Or a little over $23 billion dollars. You can see how big the ES futures market is and why it is important.

Here's a look at 3C on the ES.

 This is an hourly chart of ES with the shaded areas representing extended hours and the black areas representing normal market hours. There's still a lot to learn so I'm not going to start making predictions here, but I will point out that it does appear as if there has been recent distribution in ES trading over the last 3 days, which is about the same time 3C started picking up market distribution if you recall.

 This is a 30 min chart of the same. Notice how 3C was in line with ES until last night, when distribution seemed to take place. Today the market was virtually flat, especially compared to yesterday.

 And a 5 min 3C chart we see what appears to be continued distribution throughout the market hours today, even though ES prices were a bit higher. ES was $1189.76 at 4 p.m., it's now at 1187.25, which if you add in the multiplier is a pretty significant change.

I hope now you can see why I'm so exited about this new chapter for 3C and also why when I share it with you, I share it with you and you only, please keep it that way.

The Extent of AA's Miss

Here's the full article from the WSJ


Here's a few excerpts:


"Alcoa reported third-quarter earnings of 15 cents a share, well shy of market forecasts of 22 cents."


"Remember, analysts have been gouging their estimates for this quarter’s earnings repeatedly, down from 38 cents a share in April to 22 cents just before the report."


So, from $.38 a share, reduced to $.22 and they come in 32% lower, not a good start to earnings season, especially for a bellwether like AA, which is seen as a barometer of economic activity.


Maybe this is why the Dow looked so bad on 3C?


The DIA is trading below today's range bound market, all of the other averages are trading lower. Considering the charts, it does make you pause, no?


AA is down over 4.5% on heavy volume in After Hours trade.

VERY ANGRY!!!!!!!!!!!!!! and AA

IWhen I first started trading full-time, I bought the top of the line QuadCore desktop and had nothing but problems, I bought 2 more top of the line laptops and returned both, I told them, "I want a computer with no problems", they told me, "Buy a MAC". So I bought a MacBook Pro and have always said I would never own a PC again. Now I know I ask a lot of my MAC, I'm running their OS plus Windows 7 at the same time,  I have 4 streaming programs running, but for the last 25 minutes I have been trying to open STINKING SAFARI-I'm a lot more angry then I can repeat here and NOTHING! IT WOULDN'T LOAD A PAGE.  I tried IE, even though I don't expect much there, again NOTHING. After Force Quitting Safari 20 times, emptying the cache and history, finally it opened, but WAY TOO LATE for my post, which was AA, which I told you I was going to look at.

Here were the charts (notice the capture time) I was trying to post before AA's earnings, which must have missed because it doesn't look so hot.

 AA 1 min distribution over the last 4 days

 5 min distribution today, after first marking it up, better known as "Sell in to strength"

 AA 10 min negative divergences, but look how bad today was!

 AA 15 min negative divergence-again-sell in to strength.

I didn't intend on making this an earnings call so no harm, just frustration, but I guess you have to wonder about a leak given those charts.

ON ANOTHER NOTE


If anyone is running a MAC with VMWare/Windows and has had similar problems or knows about any routine maintenance (like the Windows disk clean up), PLEASE EMAIL ME AND LET ME KNOW, THIS SOMETIMES HAPPENS DURING MARKET AND THAT IS NOT GOOD! 


TIA.

Some Inverse ETFs

Always keep in mind the head fake whenever considering reversals, it happens all too often. A case could be made that we have already seen one, just a reminder.

Here's what some inverse (Short) and leveraged ETFs look like, consider they should look pretty much the opposite of the market averages and long ETFs.

 EDZ 1 min

 EDZ 5 min

 EDZ 10 min

 ERY 1 min

 ERY 5 min

 ERY 10 min

 ERY 15 min

 FAZ 1 min

FAZ 5 min

 FAZ 15 min

 SDOW 1 min

 SDOW 2 min

 SDOW 5 min

 SDOW 10 min

 SDOW 15 min

 SPXU 1 min

 SPXU 5 min

 SPXU 10 min

 SQQQ 1 min

SQQQ 5 min

 SQQQ 10 min

 SQQQ 15 min

 SRTY 5 min

 SRTY 30 min

 TYP 1 min

 TYP 10 min

 TYP 15 min

TYP 30 min

I would post more and more timeframes if I had time. The theme though is consistent, a lot of changes the last few days.

EFSF/Slovakia Seen as a Done Deal

Here's a link to a recent news item.

"Slovak Prime Minister Iveta Radicova put her government on the line by tying a vote on the size and powers of the European Financial Stability Facility to a confidence motion on her cabinet in a session that was underway in the afternoon.
Even if Radicova loses the vote, as looked likely, she and two of her ruling coalition partners say they will be able to produce a majority for ratification of the EFSF deal by obtaining the support of the largest opposition party.
"There is an assumption that the EFSF, one way or the other, will be approved by the end of the week," Finance Minister Ivan Miklos, who supports the measure, told parliament before the vote.
The leftist Smer party led by former Prime Minister Robert Fico has said it would be receptive — in exchange for major concessions including a cabinet reshuffle or early elections."

Buy the rumor/Sell the news? 

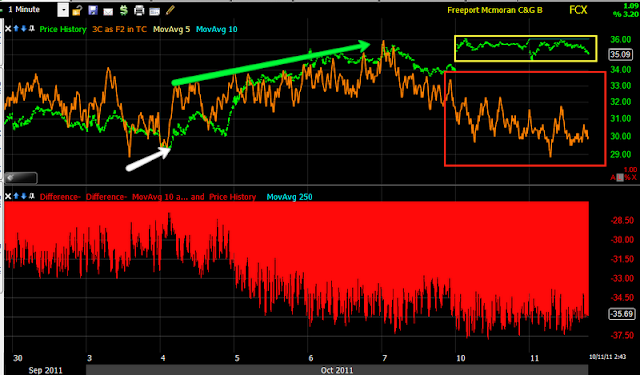
FCX/Copper

Here's another commodity (copper), although this is a copper stock) that tends to lead the market. It's not having a great day today.

 FCX 1 min-nice flat trading range, typical of distribution. You can see accumulation, confirmation and a leading negative divergence.

 FCX 5 min shows the same, a base, confirmation of the uptrend and a leading negative divergence-very ugly.

 FCX 10 min shows 2 negative divergences, the first brought it down a bit, the second is happening now.

 FCX 15 min negative divergence. Also you can see the last top and accumulation at the bottom.

FCX 30 min shows the same cycle, a relative negative divergence the last 2-3 days and it's just starting to turn to a leading negative divergence.

I meant to show this one yesterday as I had seen some signs.

Market Update Cont.

For all intents and purposes, most of the averages are lateral today except the QQQ, this is a prime distribution price pattern, although it is seemingly because of the Slovakian vote. However, the EUR/USD has rallied pretty much all day -almost a 100 pips

The S&P? +.18% The Dow -.03% The NASDAQ 100 +.86% and the Russell 2k +.31%-essentially flat.

Here are a couple of inverse market correlations.

Treasuries, the bond market was closed yesterday, but it's open today. Treasuries tend to be the flight to safety trade when the market declines.

 TLT 20+ year T's 1 min. TLT is in a 2 day flat trading range, which in this case is a prime environment for accumulation and the 1 min chart is leading positive.

 TLT 5 min is also leading positive and even more so now as this was captured a little after 1 pm

 TLT 10 min leading positive.

 TLT 15 min leading positive

 Compared to where it was on 9/28, the 30 min is also in a positive divergence.

 Only the 60 min is very ugly, but I had made mention of selling in treasuries that looked like a longer term trend after the "FADS" operation twist announcement.

VXX-Volatility that moves inversely to the market.

 VXX 1 min has been leading positive for 4 days, making new highs today, this would imply a rally in VXX and a decline in the market.

 The 2 min chart as compared to the last area of accumulation in late September sending the market lower, it looks quite a bit stronger now at the same level.

 The same is true of the 5 min.

 The 10 min is just starting to come around.

 The 15 min is leading positive

And the hourly is leading positive, but even more so when compared to its last base/rally.

I know we have some wildcards out there, but it's very difficult for me to support the idea of a long position in the model portfolio in general and is VERY hard not to call this a excellent spot for putting on a short.

On the subject of wildcards, AA kicks off earnings after market today. I'll be taking a look at AA now.