Monday, June 8, 2015

Daily Wrap

Last week the market was not acting in an even somewhat normal manner, signals were horrible, trade overall did not show anything that looked like the last bounce we expected or at least would like to have seen which led to the The Week Ahead forecast Friday, the gist of which was:

"I did consider opening a hedging VXX put for the VXX and UVXY longer term trend long positions, but I can't find enough decent evidence on the charts to justify it. There are some charts, especially futures that point toward the kind of bounce I thought we'd get this week, the kind of bounce that fulfills last week's The Week Ahead, but again there's very little evidence for that either unless the market does some serious work next week.

SPY 1 min intraday looks worse than yesterday. This does NOT look like it can support much if any bounce in to next week, so as I said, unless there's some additional short term base work put in, this market is looking dangerously close the the edge of the cliff.

...if anything I'd expect early weakness early next week...Again, unless there's some MAJOR work done early in the week, I think we'll be just taking what we can from the watch list of assets that are setting up on their own with no market support.

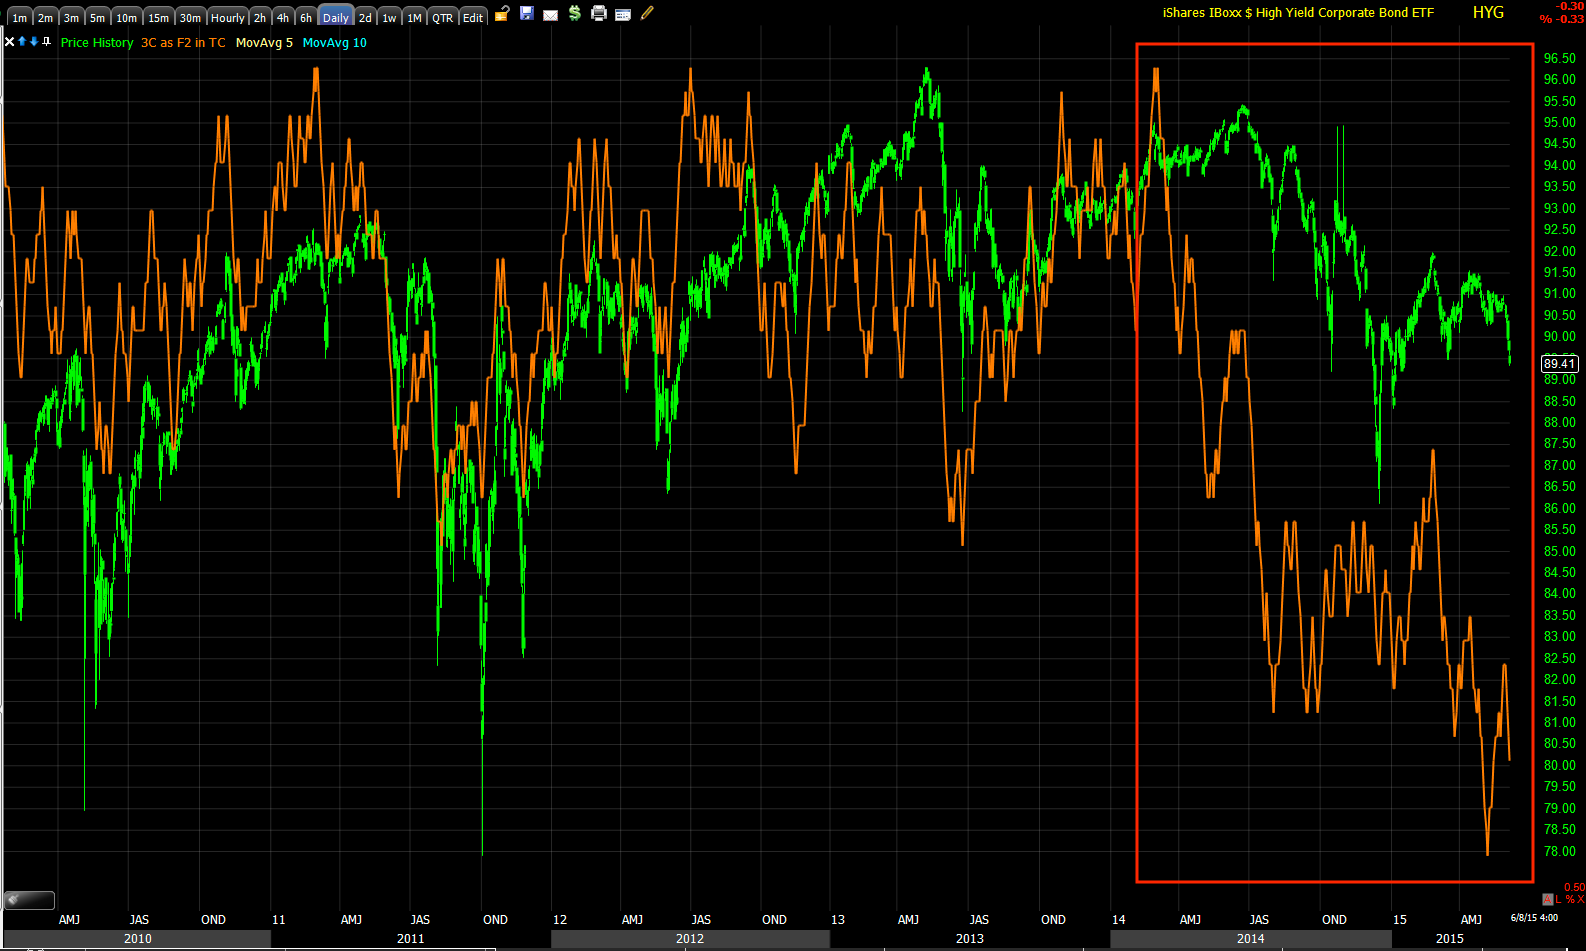
It's really not these charts that are as bad as they look, it's the HY Credit that's really screaming Bloody Murder for this market."

Honestly, I think that was a pretty accurate description of the kind of market action we saw today that landed the SPX below its 100-day moving average which has been key to the SPX...
 SPX daily chart below the 100-day ma on the close and at the lows of the day.

For the year to date, Transports are the worst performer (salmon) down -8.39%, but today the Dow-30 went red YTD as well (white), the SPX isn't far behind.

Intraday today the worst performer by far was transports with the NASDAQ 100 the second worst performer on the day.

As a reminder, the red flag of Dow theory with Transports FAR from confirming industrials and industrials going red YTD today.

It seemed to me that the day was not only seeing selling based on the indicators and simple price action, but on VWAP itself...
ES 1 min / VWAP during the cash market with several pushes to VWAP where middle men would have been looking to sell.

The $USD as we expected, after a 1-day bounce we had signals for Thursday which saw them fulfilled on the Payrolls data Friday, turned lower today as expected.

 The $USDX 1 min intraday chart today heading lower...

The $USDX daily chart since our 4/2 forecast for the $USD calling for a bounce (#1), followed by a larger trend to the downside (#2) and then we saw a counter trend rally coming with the strongest 7-day run in the $USD in over 7 years (#3). Today you can see the daily candle with a sharp, strong downside reversal. I expect the $USD's primary downtrend will see a lower low.

This may help our very short term, speculative USO long position from Friday, Trade Idea: USO (Speculative).

 The very short term 3 min $USO chart's positive divergence still suggested that Friday's speculative call position should work out fine. However the larger trade has been and remains a deeper $USO pullback which is why the USO equity shorts have been left in place.

This stronger 10 (and 15 min) $USO chart show the current negative divergence that should send it lower and then we'll look at a longer term trend long position.

There looks like there may be some near term trading opportunities in gold, 
GLD 15 min positive divergence. It seems to me that it just needs a little more reversal process, otherwise it looks pretty close.

I believe a TLT long entry for a strong counter trend bounce is also nearby...
 TLT intraday filling out what looks like a nice reversal process/base area.

3 min TLT looks even better.

Don't forget that these counter trend rallies tend to be the strongest rally you'll see in any market, bull or bear. I'll be looking to pinpoint an entry there likely tomorrow.

As for commodities, you have to go back to the $USD and Yen charts, it looks like the carry trade unwind is back inform which would make sense given stocks' performance.

Commodities (brown) tracking with the SPX (green) while the $USD's counter trend bounce and reversal were on, with the $USD moving back down, commodities are up which is natural, but also a sign of the $USD carry unwind.

As for leading indicators, I said last week and today that the market needs to do some work before I'd trust anything on the long side for either a speculative trade or even for a bounce to short in to, we didn't quite get there today as pointed out here, Market Management

However, while not screaming for any such move, there are hints that the market may try to get a small base area for a little bounce in place.

 Pro Sentiment in line with price(SPX/green) to the downside.

 Here's a larger Leading Indicator view of the same, something has obviously changed for the worse.

 And our second confirming version.

 However as I often say, the first market manipulation asset used to ramp the market or support it is HYG.

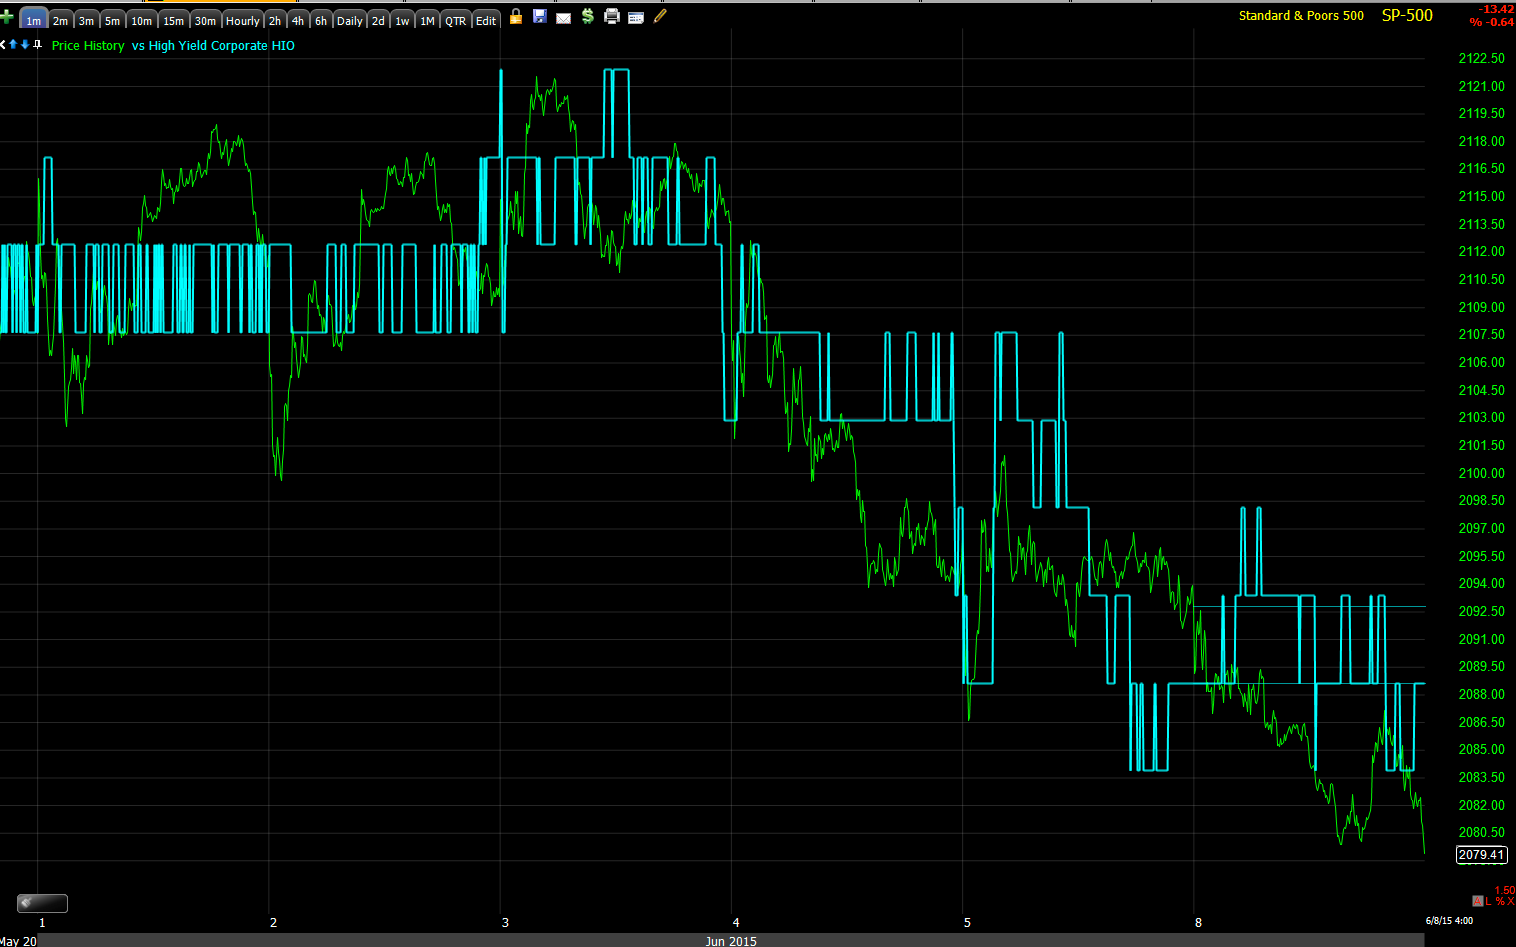
Today HYG's price ROC declined and flattened out.

The intermediate term is in horrible shape and I wouldn't make any argument for the market beyond a bounce of the oversold type at support, this chart tells us that clearly...

The longer term HYG vs SPX shows where Institutional risk on was leading at #1, where it was in line at #2 and where it went to risk off at #3. Again, I wouldn't make any argument for the market beyond a bounce off support and it still has a bit of proving itself to even get that far.

 However before HYG's price diverges with the SPX's, we get an early heads up from the 3C charts and this 2 min intraday HYG 3C chart shows a positive divergence short term.

As does this 5 min chart.

I probably don't have to say it, but for purposes of demonstration...
The most important/strongest daily 3C chart of HYG argues for nothing but a bear market in equities.

As fr internals tonight, there was no real Dominant Price/Volume Relationship. The only 2 averages to get close were The Russell 2000 and the SPX and both were Close Down/Volume Down, the least influential relationship of the 4. However interestingly there were only 8 Dow stocks > their 50-day, 38n NDX 100 stocks, 874 Russell 2000 stocks and 169 SPX-500 stocks, breadth is clearly very questionable.

Of the S&P sectors they looked a lot more like a 1-day oversold condition with 9 of 9 red with Tech lagging at -1.12% and Consumer Staples leading at -0.04%.

Of the 238 Morningstar groups 212 of 238 closed red. This looks like a 1-day oversold condition, if the Dominant P/V showed the same, I'd say we'll bounce tomorrow, instead I suspect we may build out the reversal area for a small bounce, the "Work" I said the market needed to do last Friday if it has any chance of seeing any upside which we can use for entering short positions as NFLX and Transports are bellwethers for the others and unlike Friday as they diverged a bit wit the market, today they couldn't withstand the gravitational pull. They'll need the market as I originally thought to get anywhere near a better entry with much lower risk and better timing, although since the head fake above the SPX's ascending triangle, it seems to me our April 2nd forecast is coming true rather accurately.

As for futures tonight, I was surprised today how in line most futures were and this is not just under futures, but everything from currencies to bonds, VIX futures, Treasuries, etc. I suspect tomorrow will shake things up a bit more and create 3C movement that creates opportunity.

 ES1 min looks like most futures all day today in multiple timeframes, in line even as it lost more ground after the close.

The NASDAQ futures look a bit better.

TF is in line like ES.
 However, I don't see HYG accumulation , even very small scale as we see above, being carried out for any reason other than short term market manipulation/support, so I'm guessing any new shorts on the break of the SPX's 100-day are about to be kicked out of the trade which hopefully will give us the room we need to enter the trades we have been patiently waiting for to set up- they haven't fallen apart (like NFLXX), they just need that extra little boost to reduce risk and give us the best entry and timing.

I believe HYG is the asset the crowd missed, at least the 3C chart, we'll see tomorrow and we'll see about USO, gold and TLT/Treasuries which I think will all present opportunities tomorrow.

Market Management

Since our April 2nd Market Forecast in which we were looking for...

 Note where April 2nd is when the forecast was made which expected the resistance trendily at the 2015 triangle which only grew larger to see a head fake/false or failed breakout, then at 2 we expected some loitering around the apex or the breakout area before prices headed lower to the 100-day at 3, which is where we are now.

I expected some loitering and game playing around the 100-day, but ultimately, this time for it to fail as the head fake move that we see so often before a trend reversal was or is in place (at #2). So for me to do anything other than sit on longer term core short positions patiently as we have been waiting patiently for this scenario to play out exactly as it has since April 2nd, I'd need to see something much stronger than today's intraday trade. When I said the market would have to do some serious work early this week to be trust worthy of any short term counter probability trades, I meant more than part of an afternoon.

This 1 min SPY positive leading divgerence looks impressive, but it's a 1 min chart and only a couple of hours at most of accumulation, that won't support much of anything.

 Remember the flag and the break above it that failed? From these failed moves come fast reversals, in just 3 days look where we are at the last stand or the most important for the SPX at the 100-day. Of course the 200 day is there, but the 100-day has been defining SPX support.

In essence since the failed attempt to break out of the flag and fast downside reversal, I would not trust a tight "V" reversal such as we have in place right now. The market needs to prove itself if it can bounce and give us some nice opportunities, otherwise I'm not moving off the rock I've been sitting on since April 2nd that has gone as we projected for a couple hours of a divergence on a 1 minute chart today.

It will have to do a lot more than that and even then, it's still a brief reprieve.

SPX Breaks 100-day-Greek Rumors Again

Sometimes it's a bit hard to tell which came first, the chicken or the egg and in the market (specifically today), whether the internals were showing the correct information or the 30-second soundbite as to why the market pushed off the lows which is another "Greek" bailout rumor, namely the WSJ's "

"Greece’s international creditors have suggested extending the country’s bailout program until the end of March 2016..."

Apparently though, the strings attached have already been reported as a red line for the Greek government, thus it's just another story, no progress as the Greek government is sticking to the position that the only deal on the table is the one they drafted and submitted to "The Creditors" or whatever they had the Troika called.

From an internals point of view, it looks like the 100-day for the SPX was taken out around 12:45, watch what happens to the NYSE TICK data around the area...
The channel doesn't see TICK hit the lower trendily, internals improve, and before the Greek news hits.

 It looks like stops that where hit, although not too heavy from what I see, were accumulated around the area .

And on a daily chart, the 100-day SPX is right at support, Greek news timed as it is actually non-news?

Like I said, the chicken or the egg, Greece or internals. In any case, this isn't the kind of base area that I'd say has "done it's work" as of yet, but we are getting some movement and that creates opportunity.

Where the opportunities look best and whether they look strong enough to be a high probability/low risk trade is another story, just like earlier, it's just a matter of time and letting the market tell us where things stand.

Market Update

From a divergence/trade set-up point of view, the market is has been dull today, mostly confirmation as I just went through 10 different futures from Index futures to currencies, to VIX futures, gold, oil and Treasuries and looked at each in 8 different timeframes.

The moral of the story for the most part is the market is doing what 3C has been saying it would do, although this is far from the worst chart...However there are some intraday surprises building in the area, none I would take action on yet, but getting more interesting...
 60 min ES / 3C chart with a leading negative divergence and price is moving toward that divergence.

The same chart except the NASDAQ 100 futures.

Intraday, the SPY can't get anything going past a 1 min chart, the 2 min charts and longer are confirming all of the downside not only from today, but since last week and near perfectly.

 One interesting spot, but also something we had forecasted quite a while ago, the carry trade looks to be under growing pressure again and that makes sense.
 The 60 min $USD after the strongest 7-day counter trend bounce (or any move) in 7+ years, it has failed and is heading lower.

A couple of years ago I wrote that the Yen would head higher as the market breaks down and we have been watching that divergence/base build...
The 60 min Yen Futures leading positive divergence.

In other words, all of the things we have been looking at that suggest we have topped and the carry trade is unwinding are all showing up.

Now intraday interest...
 SPY 1 min leading positive,  this is the best intraday SPY divergence of the day, leading positive.

It looks like it may have found a toehold in the area.

The Q's are showing something similar on an intraday 2 min chart.

The DIA as well.

Like I said, I wouldn't go charging off, but at least now some potential opportunities are more likely to open up.

I'll likely have some more intraday updates as things can happen quick from here.

Market's Bigger Picture

I don't want to get "Lost in the lines" or represent the market as an intraday affair, there's a much bigger picture at hand and in play and we need to be aware of that as all shorter term charts are meant to be used to allow us to position for the larger trend.

If we go back to the April 2nd Market forecast with AAPL as a proxy for the market simply because it had the clearest triangle which I suspected was the play the market was setting up  for a head fake move, IMPORTANT: AAPL Set-up & Market Movement,  this is what the SPX looked like at that point...
 As of April 2nd's forecast linked above I was looking for market triangles, we got even clearer triangles since 4/2 like the SPX's "bullish looking" Ascending Triangle.

We were looking for a false breakout above those triangles and for that breakout to fail and the reason we already expected the breakout to be a head fake over a month before it began were the long term charts with the highest probability resolution, charts like this daily ES (SPX E-mini futures)...
By April 2nd we already had the highest probability resolution for the big picture in the market with this ES daily chart's leading negative divergence.

The head fake concept is very strong which made it pretty easy to forecast ad we had proof that the triangles up to that point had already shown us that they were not random or naturally occurring, but engineered as the 3C divergences proved. To create a bullish looking ascending triangle, there's really only one reason and that's to get retail chasing it, but with the chart above and others, we knew how it would end before it even started. 

Here's what has happened since.
The SPX formed a larger ascending triangle and did make a head fake/false breakout above the range. We confirmed distribution in to the move and it did fail as forecasted on 4/2.

We even expected a move down to the 100-day moving average in yellow and this is where I think the market is in trouble and at a very dangerous crossroads...

While I usually expect some kind of game playing around the average, maybe even a little bounce, you've seen how bad the charts look. This 100-day (yellow m.a.) has held numerous times as support, but since we have a head fake move in on the daily chart above, I suspect this time it will fail.

 This is the 60 min SPY chart and the head fake/false breakout area is in the yellow box, note what 3C did in the area and since confirming the head fake move or false breakout.

And the daily chart pretty much ends the debate.

Interestingly, as you might recall on Friday I said you can't consider any analysis without considering the HY Credit analysis as it is key to the market, that would be this post with the HY Credit analysis, What High Yield credit is Screaming

 Along those lines, this is HYG's daily 3C chart, leading negative on the strongest timeframe we generally use.

In addition, as a Leading Indicator, not only has it broken down on a big picture basis...
High Yield Corp. Credit (red) vs. the SPX (green) on a daily chart, especially from mid-2014 through 2015.

HY Credit has broken down on the intermediate and shorter term timing charts.

The SPX again is sitting at the 100-day...
Actually the SPX has broken below it intraday today, but there's usually some short term game playing around these moving averages that are seen as key.


While I hope we do get a decent bounce to add some nice positions that need it (take NFLX or Transports as I have recently posted them as trade set-ups), there's big trouble right ahead.


 The intraday charts are still looking like they want to bounce in the area or find some toe-hold. It may take a big stop-run on fear selling as the SPX breaks the 100-day, you can see volume picking up in SPY as it did.

The VXX which trades opposite the market is showing a short term 1 min negative divergence suggesting intraday to may come down and the market may see some VERY near term support, but it would still have a lot of work to do even with that.

TICK shows it's not out of the question that the market does some of that work...
As this morning's 1 min downtrend is being broken , but not screaming, I certainly wouldn't be bullish.

And this is still the reason why...
 The SPY 2 min chart is still confirming downside and hasn't seen any positive divergence migration. Right now this is not looking good for the market.

 VXX 2 min is not going negative on its 2 min chart so whatever the market has done on the positive side today, it's not the work I said it would have to do on Friday, it's skin deep.

That may change with a nice run on stops and offer the market a brief reprieve, the thing is, it could just as well go the other way.

The longer term VXX 10-15 min charts have been pointing to someone buying a lot of protection.

The point is...just don't get lost in the lines, keep the bigger picture in focus.