I've been showing you this risk layout for quite some time. When the market is rising and I'm showing you these divergences that are red flags, I can understand how it might seem not very useful. Today was a picture perfect day of why it is useful and if I had to sum it up in one statement it would be, "Reversion to the mean". On a short term basis you have seen the power behind these divergences and why I look at indications such as credit, yields and currencies rather then show you a bunch of MACD histograms. Hopefully you'll see in today's action the concept of reversion to the mean and look at the bigger picture these charts are showing and have a new appreciation for exactly how much trouble this market is in.
Before we look at these charts, I want to show you one other thing. I think we have a nice advantage to be able to have an idea of what smart money is doing before it is reflected in price. Yesterday I closed FAZ calls and AMZN Puts (which were both very short trades of a day or so) for a 31+% and 7+% gain respectively. Today I closed FAZ calls open less then a day for an 11.5% gain and later I closed AMZN Puts that hadn't been open for more then a day at a 20+% gain and then AAPL puts (more for a expiration reason) for an 11% gain. These aren't high flying percentages, but not bad for mostly 1 day trades precisely because we can see what smart money is up to before price reflects it, these are just 2 days of trades. I could have closed BIDU today for a 20+% gain. Not that I care much about the rank, but that puts the options model at a weekly rank (2-days) of #35 out of 1852 portfolios and this in what has recently been a very choppy, volatile market.
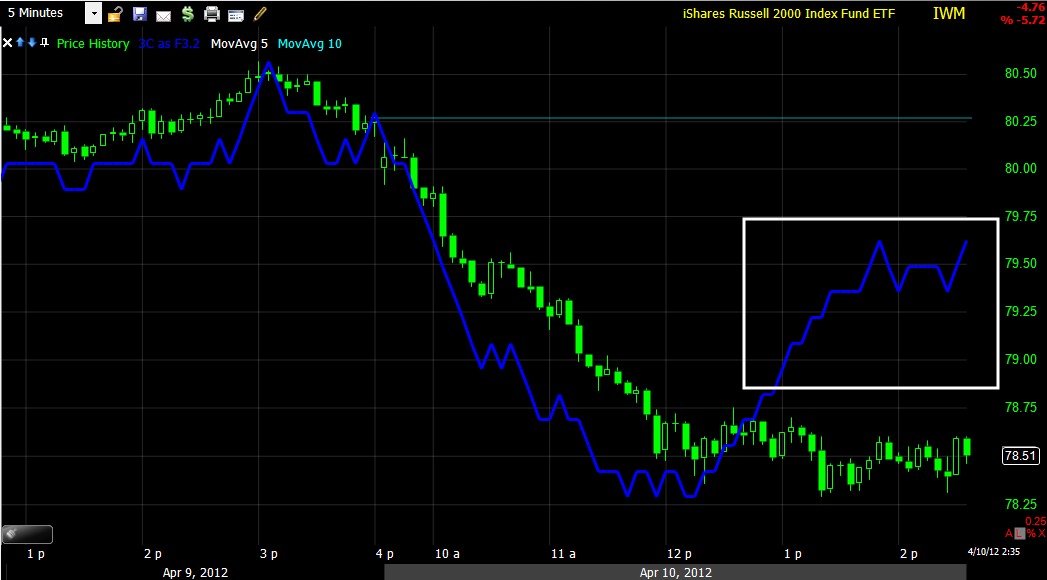
Where I'm really going with this is the potential of loss or if you are on the right side of the trade, the potential for gain. Take a look at the Russell 2000 today (Remember Goldman Sachs long Call on the Russell 2000?)
As of today's close, any long in the R2K who bought in the last 53 days and as many as 56 days, about 12 weeks of long positions are at best break-even, but most at a loss.
Look at the R2k a bit closer... When I taught Technical Analysis/Trading for our public school system's adult education program, my goal and biggest challenge was to try to get students to look at a price chart as an emotional barometer; ultimately fear and greed are what move the markets so looking at a chart and putting yourself in the moment emotionally will teach you more about the market then any MACD divergence or moving average crossover.

Looking at the R2K, 11 days ago it made a new closing high for this rally and closed at the high. Longs are eternally optimistic, especially after a rally like what we have seen. For the most part, people who have made money in the market or missed making money and just got in, don't want to believe the party is over and will almost always give the market the benefit of the doubt. So when the R2K pulled back over the next 3 days after the new high, it was "It's just a gap fill". When the R2K dropped to the mid-March lows it was, "We are at support, this is a good place to buy more". The next day the market gapped down against them, do you think they likely sold? Remember, longs have been conditioned for months by the motto "Just buy the dip". Today's move likely scared quite a few of the longs enough that they most likely sold and most probably at a loss-as mentioned above, we have nearly 3 months of longs who would be at a potential loss and the events that triggered that took place realistically, emotionally, in 2 days.
Lets look at where the sellers realistically were

There was some panic on yesterday's gap down, then some more panic early as the IWM broke below the a.m. support. Then the IWM moves above yesterday's a.m. range, those sellers are probably feeling like they made a mistake, a portion of them would have jumped back in (we've all felt that remorse of closing a position and then seeing it go the other way). Today we saw a lot of sellers early, look at the volume and that continued throughout the day. I also notice the bid/ask in AH is almost above the afternoon "U" shaped range, so it's likely some are buying in after-hours. This is all emotional reaction and earlier today I tried to explain how a bounce would play in to that. Last week we saw the S&P make a new closing high, we also knew that there was distribution in to that move higher. Today, only 5 days later and only 1 or 2 days in to it, those buyers are at a -4.25% loss just on the S&P (for most stocks you can usually just about double that).

The new intraday and closing high at the red arrow, the same one we saw distribution in to. The pullback from that high would not have been seen as a threat, but a buy the dip opportunity, yesterday and today would have changed that in a hurry.
Back to my original point, the divergences in the risk layout warned of this and today we saw short term reversion to the mean. The scary part is the long term reversion to the mean and how quickly a market can fall while most traders are emotionally in denial. So here are the Risk Layout charts with reversion to the mean and the big picture implications (also why I won't go long a positive divergence that looks pretty clean at this point-the moment the break comes, it will come fast, faster then today).

Commodities are a bit divergent with stocks, I suspect the reason is that commodities are following the legacy arbitrage of the $USD while stocks were more in a panic mode. I do not believe there's much that happens in the market that Wall Street hasn't set up. There are events like 9/11 that take them by surprise, but for the most part, we have seen these cycles set up in advance; take the positive divergences today or take the negative divergences we have tracked in to each run up in the market over the last 3 bounces, each making a new high.

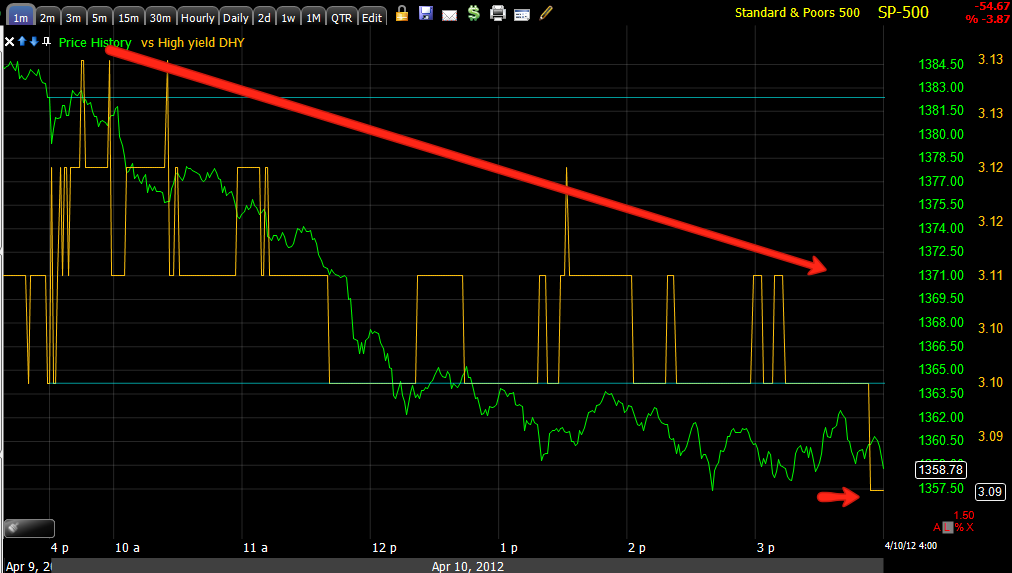
I just want to show you High Yield Credit on the close at a new low for the day. HY credit has good beta and compared to the SPX it is VERY cheap. Why isn't HY credit rallying? The same reason it hasn't rallied or made a new high since Feb 6th; the credit markets are large and traded by smart money. How many of us trade credit? Probably none, smart money has been selling credit and there's a reason, these guys are WAY ahead of us on the information curve.
I often compare Yields to a magnet for stocks. Yesterday when the market was bouncing in to the afternoon yields were sideways or divergent. Today the SPX (green) has reverted to Yields' short term mean.

This is a daily chart of Yields vs. the SPX. During mid 2011 and particularly during July, Yields diverged from the SPX, the reversion to the mean came only after a 20% plunge in the market starting late July at the first green box. Again the market bounced a bit and yields were divergent, the market reverted to the mean hitting new lows at the October lows. 3C has been showing a huge negative divergence in this rally on the long term charts, I haven't trusted this rally at all, but members who have been with me for a while know all about that. What is particularly scary right now is the depth of the divergence between yields and the market. You've already seen short term reversion to the mean and on this chart longer term reversion to the mean. So, is this time different? Based on the evidence of the charts above, do we have reason to believe that the market won't revert to the mean once again because it would mean such an intense drop in the market? I don't listen to CNBC for a very specific reason, I want my analysis to be fact based, I want my analysis to be a reflection of what I observe and not what some pundit who most likely works on Wall Street has to say. After all, that Goldman Sachs "Long the Russell" call didn't exactly work out too well when they closed it yesterday at a loss and I don't believe for a minute that GS took any loss whatsoever or that they give free advice.

The $AUD which has been an excellent leading indicator among the currencies shows several short term divergences with the SPX in the red boxes, today, a short term reversion to the mean in the green box.
Longer term, the $AUD has been selling off while the market has been moving up. The $AUD is part of a carry trade, meaning the $AUD is used to finance stock purchases so as we see that carry trade in the currency being unwound, it means they need to sell stock to close out the carry trade. Ask yourself, is smart money going to sell in to a falling market or were they more likely selling in to strength as 3C has shown?
Here's the Japanese Yen vs the SPX, another classic carry trade currency. All you have to remember for the general correlation here is when the Yen rises or spikes, the market declines or crashes. In red we have the Yen moving up, almost certainly because the Yen is being bought to close out the carry trade, the market is lateral so we have divergence in the red box. Today that divergence reverted to the mean as the Yen spiked and the market dropped.

On a daily chart there's two things, one is that a consolidation in the market is never a parallelogram that moves with the market's trend, consolidations are either lateral or parallelograms that move opposite the prevailing trend that precedes them. The second thing is the rising Yen is almost certainly because the Yen carry trade is being closed out, which requires you to buy the Yen. Again, to do this, profits need to be taken on stocks as the carry money that finances the trade has to go back to buying the Yen to close out the carry. So is smart money going to sell stocks in to strength or weakness? Many technical traders see days like today and believe it is smart money selling, all the evidence I've seen over the years with 3C says that smart money was out and likely already short on days like today when the market falls. Just think back to the last two bounces (early last week and early the week before), both saw 3C distribution in to higher prices, smart money sells / short sells in to strength. The closing of the Yen carry and the $AUD is a clear signal that the party is over.

High Yield Corporate credit, again is exceptionally cheap compared to the SPX and has god beta, yet it's not being used on bounces, it is consistently being sold. This chart is backed up 1 day, you can't see today. You can see the HY Corp. Credit divergences with the SPX, and today....
In the green box, short term reversion to the mean. If this were a healthy rally, HY Credit would be participating, that's why we watch credit markets.
Now that we know divergences ultimately will lead to a reversion to the mean and Credit markets are much better informed then equity markets, look at the longer term in credit which has been selling off and now making new lows as I expected it would last week. Again, there will be a reversion to the mean. These are risk assets and the only one of them to rally is stocks where you find dumb money. You don't find dumb money trading rates or credit, we trade stocks.
This should give you some idea of what the bigger picture will look like and hopefully show you why we have been following these markets; they have been warning and going back to how many longs were trapped in the Russell 2000 in 2 days, I hope it goes to show when it is worth taking the risk of being long and hen it simply isn't as you can watch months of gains evaporate in to a loss in a day or two.