Tuesday, December 20, 2011

RIMM makes an AH move

After putting in a positive divergence most of the day, RIMM moves up 10+% in After Hours trade.

 Here's the after hours move, note the positive divergence on the short term chart all day.

 Again, the 1 min chart showed a positive divergence during regular hours

And the 15 min hart which was originally strong enough that I thought this may be an earnings play (they beat on revenue, but had poor guidance) is showing an even stronger leading positive divergence on this important timeframe. It may be RIMM was under accumulation for an entirely different reason. We'll see what it does during regular hours. I still hold March calls in the options model portfolio.

ES AH Indications

This is early on, but a leading negative divergence at the highs is not a good sign.

More on the ECB's already failed LTRO

Tomorrow the ECB will offer 3 year liquidity to EU banks that can put up sub-grade A paper as collateral, the thinking is the banks will see a carry trade at 1% borrowing costs and 5% yield buying PIIGS debt.

However, some of the top bankers in the EU have already made their plans clear, so while the market throws another sugar rush party which we had been expecting, the writing is already on the Wall. The following are quotes from EU banks re: the ECB's LTRO tender:

"When investors are constantly asking what you have on your books and the board is asking you to reduce your exposure, it doesn't really matter about the economics of the trade," said the treasurer of one of Europe's biggest banks. "Am I going to buy Italian bonds? No."


Unicredit, one of the biggest holders of Italian debt said:  Using ECB money to buy government debt "wouldn't be logical". 


"I can't think for a moment why anyone would want to [buy eurozone government debt]," said the head of capital markets at one European bank that is also reducing its exposure to eurozone sovereign bonds. "Everyone is trying to protect capital. It's counter-intuitive. It would be digging a deeper hole for yourself."


"Banks need this liquidity to get them through the wall of refinancing they are facing next year. That's where the money is going to go."


While steps are being taken, the crisis is far from over," added Mark Schofield, an analyst at Citigroup. "There is ample scope for rewidening as the market gets ahead of itself and as each bubble of optimism is pricked by reality. At the risk of sounding like a broken record, things will get worse before they get better."


It seems Sarkozy's call: "Each state can turn to its banks, which will have liquidity at their disposal,"  seems as if it is DOA, like all other EU bailout plans.

ORCL Misses-sends NASDAQ 100 lower

The earlier low print in AH in the NASDAQ 100/QQQ apparently was because of ORCL missing on earnings, and pretty bad on revenues.


The Euro

 Here's our Euro led bounce we were expecting late last week, today it has the look of a bear pennant in the red box.

Coincidentally (?) this sell-off in the Euro happened around the same time the US 1 month Treasury results came out, the one in which there were 9x more buyers then treasuries for auction and they priced at 0.00%

That is still sticking with me, there's no gain at all obviously at 0.00% so the money is being parked at the treasury for safe keeping, the odd thing is that there were so many potential buyers and it's a 1 month Treasury. What do they know that has them so scared they are willing to let $30 billion in essentially dead money sit in the Treasury rather then any other bank or investment class? And the 1 month duration? More then a little odd and definitely not bullish.

Q's are down in AH

At first I thought this may be a bad print, but I verified it.


Not sure what this was about, but the low was $54.31 on huge volume.

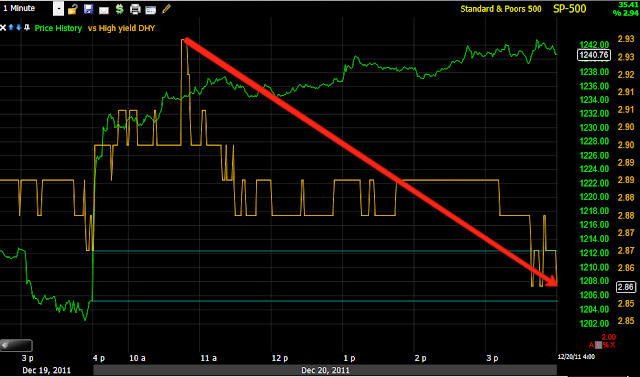
High Yield Credit moves to multi day lows

Someone either knows something or is simply not willing to take the chance that tomorrow's LTRO disappoints.


These are new multi day lows and HY was bid up yesterday, apparently profits were taken early today and it has been downhill since then.

FXE/Euro Charts

 FXE short term 1 min

 2 min never even confirmed

And the 15 min which was the reason for thinking a bounce was coming has fallen apart badly in a single day

EOD Update

 DIA 2 min, this is not a huge deal, but..

 This 5 min chart is .

 SPY 1 min

 SPY 2 min

And again the 5 min not looking great here.

FAS/FAZ confirm

FAS the leveraged long financial ETF and FAZ the leveraged short  financial ETFs confirm the XLF chart.

 FAS goes negative


FAZ goes positive.

This is still early, but may be the start of a bigger move.

XLF Update

Remember that parabolic move up I said I didn't care for in XLF.?

 The last update 3C was moving up sharply with XLF moving up parabolically, now we have a sharp downside 3C move, which may be the start of something bigger, FXE/the Euro is not holding up well.

XLF 2 min 3C looking a bit toppy here.

FXE Not holding up well Today

There's a lot of underlying distribution

Bill Gross Tweets

Treasury Also places 5 year bonds today at .88% Interest

Wow, someone feels a lot safer on this side of the Atlantic, so much so they are willing to take a measly less then 1% return for holding a 5 year treasury.

Unreal. This looks very much like the Treasury has become the concrete garage everyone in Florida looks for to park their car when a hurricane is coming.

Something is NOT Right

The Treasury sold 1 month bills today at a yield of, believe it or not- 0.00% and the issue was for $30 billion, but there were $270 billion of buyers lined up, 9:1.

Unless I'm really missing something, this looks like some big money in the very short term would rather park their money at the Treasury at 0% interest then have it in a bank, afraid of a banking collapse? And remember, these are 1 month bills!

Something definitely is amiss.

Financials looking better then Tech for now

 The 1 min XLF, the only thing is it is starting to look a little parabolic right now.

 The 2 min is inline for the most part.

 As is the 5 min and this can be seen in BAC...

 Here's the recent move that is looking a little parabolic, which in my opinion is never good for a trend.

 Look how they are keeping BAC as the VWAP despite heavy distribution.

 XLK definitely looks different then XLF and the negative divergence can even be seen in price performance as XLF is hitting new highs and XLK has just baked off from them

 The 2 min in XLK looks horrible, which means for my purposes, the shorts I'd be looking at today would largely be in tech.

 The 5 min looks as it should for a bounce, but a bit weak on the right side.

And AAPL looks to be seeing distribution here, not making new highs right now either. Still probably a candidate for a phased in trade, but we'll keep watching for a screaming signal.

JEF pops on earnings, Speculative trade...

JEF popped on earnings, and a balance sheet reduction, which is ironic because we just talked abut how these financials reduce their liability/balance sheet in window dressing before earnings and here we have JEF popping on that very issue, not sure the market will believe it, but there was enough short interest there to create a squeeze, now it looks like fading the pop may be a decent speculative trade.

 Both short term charts showing leading negative divergences, I would consider this a speculative short right here.


Credit/Risk basket indications

These assets are very important in judging a bounce, whether it has legs or whether it's a good tactical use of price strength to short in to. Risk assets which include equities should show broad strength in a healthy bounce, in a shifty bounce there will be dislocations between them as we have seen over the last month, leaving the S&P way over valued compared to other risk assets, and these dislocations revert back to the mean, meaning equities can fall quickly to the levels credit and other risk assets are trading at, or in a bullish scenario, credit will pop first and equities will follow.

Here's today's update:
 Here are commodities in tan vs the S&P in green and the Euro in light blue, commodities are going to rise on a weaker dollar, but are stuck somewhere between the S&P (which is breaking away from the Euro correlation as they try to keep the market up as long as possible to sell in to strength) and the Euro/weaker dollar correlation.


 High yield credit saw some buying yesterday, getting in position to sell on strength today, I mentioned this in yesterday's credit update, you can see yesterday's chart by clicking on the link. Today it's being sold, so they made a decent little trade, but obviously they don't want to be holding some of the lower quality credit when the market reverses, so High Yield is definitely being sold after getting the bounce this a.m. and being in position to capitalize off it yesterday.

 Rates are more or less in line intraday, daily they are severely dislocated.

 As mentioned above, the S&P is holding up better then the Euro right now as they will try to keep it as high as possible for as long as possible to do the same thing we are looking to do, sell in to strength.

 I also pointed out in yesterday's post (linked above) the move in High Yield Corporate Credit, which is now at a profit on the 1 day trade, but showing some initial signs of being sold. Apparently it appears that institutions don't want to be caught holding this credit if tomorrow's LTRO is disappointing.


As you can see on the last chart of the BAC VWAP, it opened above the VWAP and then has spent the day just trying to hug it, that is reflected here in financial momentum as it outperformed early on the open in green and since has fallen off from the s7p's relative performance.

All in all, everything looks as expected, no unwanted surprises here.

ES distribution and BAC's VWAP

 Here's the 1 min 3C for ES, the distribution has started almost immediately as they sell in to strength.

In my last pot I mentioned how distribution often occurs in a flat trading environment and that BAC was probably being sold by the middlemen that facilitate major institutional transactions, market makers and specialists. I could tell just by the price movement that BAC was being held at the VWAP as the institutional customers that give the market makers/specialists the order to sell or buy big positions, use the VWAP to judge the middleman's performance in filling the order, no large institution wants to be selling BAC below the VWAP, so market makers try to execute near the VWAP and thus get more order flow from the large institutional clients. So I took a look out of curiosity and look at BAC today, holding the VWAP near perfectly.

Distribution, as expected

I was looking at the q's and noticed the distribution starting already as has been expected on the bounce that has also been expected. I thought the easiest way to see real distribution would be in BAC as it is the one stock that institutional money would like to get out of their portfolios before the end of the quarter which would be the 27th for settlement purposes.

Sure enough, BAC is using, as I said yesterday, "Any strength to distribute the stock".

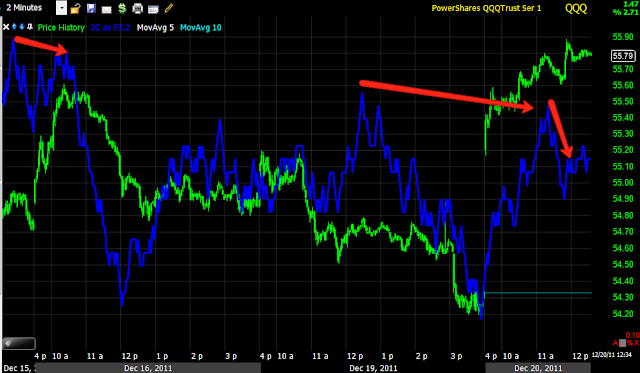
 QQQ 1 min positive divergence at the end of day yesterday just like I described in ES yesterday and some distribution already starting.


 The 2 min confirms distribution, although it doesn't look really heavy quite yet, however do note the attempted breakout to new highs saw a leading negative divergence today.

 And the reason we have been expecting a bounce, the 5 min QQQ hart with accumulation to sell in to the bounce. We see some relative negative divergences, but not heavy distribution yet.

 BAC 1 min, they are wasting no time trying to sell BAC in to some price strength, the 1 min s leading negative, indicating heavy distribution and BAC's price is relatively flat, another sign of accumulation/distribution as the middlemen try to fill orders near a short term VWAP.


 The 2 min shows distribution as well

The 5 min is not where I would consider shorting BAC at a full position, but I would nibble at it here if BAC was a position I wanted in my portfolio. I already have enough exposure to financials so it's not a trade I'm interested in at this point, but for others, it may be.

AAPL is close....

It's pretty difficult to guess how much liquidity the banks will take in tomorrow's LTRO, it could disappoint the market and end the bounce like that or it could be supportive and we get some more upside, I don't know that the market is aware of what the banks will do and thus if it can be disounted in underlying trade.

 AAPL is lose to the area I wanted to se it at, however, a positive LTRO could give AAPL a head fake move that would make for an even better entry/add to.

 On a daily chart, this is what the head fake would look like, a move above local resistance on a head fake and a failure, this is without a doubt the best set up for shorting/adding to AAPL.

Short term it is showing some hints on an intraday pullback as well. It may be a situation in which a phased entry makes some sense, if you did that, make sure your risk management /position size is wide enough to allow for a head fake move.