Wednesday, October 30, 2013

FB as a Barometer

Well I knew there was unusual accumulation in FB very short term and heavy distribution very long term, but I didn't think my comment from earlier...

"At first FB had some pretty nice intraday charts, they look better than the overall market, however as I got to longer charts, the damage there was obvious. FB may be good for a rip and dip, but it's just not strong enough for me to take on as an earnings play."

Would play out so fast...
FB ripping and dipping in AH alone.

The market is much weaker than I've ever seen it. I think we are at a pivot that is not only important to the 10/9 cycle, but the entire of 2013 and even bigger, likely the entire 2009 through present.

I'll get in to more detail when I don't have to rush through it, but the essential plan remains the same, there was some short term divergences toward the EOD, I think we are best off using these to short in to whatever strength is left as retail seems to be firmly holding the bag based on the market's actions today, only later did it seem smart money stepped in to set up what looks to be a very small cycle, thus me closing the AAPL Put again, I'll give you the P/L on that position tomorrow, but it was another small gain, but the gain wasn't the point.

Hopefully we'll get a shot in stocks like FB, but what I saw after hours tells me a lot of things we have been seeing are firmly in place and it's not going to be good for the market. 

The days of buy the dip and "Aren't we smart" are fading fast, you'll need an edge and be able to track like a hunter, like a wolf, I think not only do we have that, but the reduced liquidity environment will actually make it easier for us.

I have a lot of other thoughts I'll share with you, but mainly I'm saying I think the pivot we are at is more than just a reversal from the 10/9 bounce, a lot bigger.

I'll see you in a few hours, THE PLANS FOR NOW STAY THE SAME...

Stay patient and let the trades come to you, there are plenty and you have time.

FB After Earnings & a Note

* First let me mention that the Daily Wrap will be a bit later tonight as I have a Board meeting to attend, but basically what we have been seeing is there. There's a major break and while I don't want to repost all of these charts that have been posted a dozen or more times over the last week showing all the details as you know what they show, to summarize I'll get in to some of the ins and outs, why and why not. Essentially the strategic break is huge, it's there, but I closed AAPL puts because of tactical concerns, I left the less leveraged shorts open because I'm not concerned over tactical issues with 2-3x leverage, many of which have remain unaffected even as the market went higher.

I'll get to that later, first though I wanted to go over FB as I saw it a bit before the close and the short term charts looked like something was up, in fact my terminology was,

"At first FB had some pretty nice intraday charts, they look better than the overall market, however as I got to longer charts, the damage there was obvious. FB may be good for a rip and dip, but it's just not strong enough for me to take on as an earnings play."

One quarter I wanted to show that there were earnings leaks or at least somehow smart money knew, it wasn't widespread, but it happened. So we took a quarter and I looked at just about every major company reporting, I can't even tell you how many charts, but of all of those I believe it was 22 that were selected as earnings trades as they had signals jumping off the charts that just couldn't be ignored, our hit rate was about 90+% on these, however don't forget that these 22 or so were only a fraction of the hundreds, maybe thousand+ I looked at.

FB seemed to have something that looked like a leak because it had been sent down where it could be accumulated cheaply very recently and the accumulation (all short term, not positional) was way above what I was seeing in the market in general. However I have very strict standards for earnings plays because they are such a wild card, I thought FB would likely rip which it did after earnings and eventually dip so it will be the Dip trade (the longer trend trade) I'll be watching for.

This is the kind of behavior that looks like an earnings leak, even though it's only a 2 min chart, for one the stock acts different than the rest of the market and in coming down off the 10/18-10/21 highs, the lower prices give those in the know a chance to buy a larger position on the cheap. 

That leading positive divegrence is a lot more vertical than most, so it looks like there was a very strong push to accumulate FB, still there's not enough time for this to be positional, it's short term trade, like earnings.

The 3 min chart also doesn't look like much else in the market, while everything else is seeing distribution and leading negative divergences, this chart is at odds with the market as a whole, that's a common marker in leaked earnings.

 This is where the longer term (beyond an earnings rip) trouble is, this is very much in line with the market on a 4 hour chart so that's a significant signal.

 The hourly chart is showing trouble too, it's not as bad as it could be and I'd imagine any upside in FB off earnings will see this chart turn to more distribution as they almost always are selling in to demand and higher prices so this chart makes even more sense after earnings.

The same can be said for the 10 min chart, it shows the accumulation period (not earnings related) and the in line trend confirmation and a relative negative divegrence, but it's not in the same kind of trouble as say the IWM, that means higher prices over the next "X-days" are very likely to see this chart deteriorate badly as well as higher prices are distributed in to.

That's where we want to look for a longer term trending entry, at higher prices on deteriorating charts, the same as we want to buy pullbacks showing strong accumulation as I suspect gold will do as it moves lower.

FB is on the radar. I just hope FB can hold prices long enough to see these charts deteriorate, I'll get in to that a bit too, but it has its roots in last night's late post on Hedge fund activity.

I'll be back later tonight after my board meeting and wrap it up, but I think for the most part everything is looking pretty clear between the massive negative divergences and the very short term positive toward the EOD.

Trade Set Up: Transports

Transports have been strong lately, some say because of lower oil prices, however I've seen transports too many times used to prop the market up.

I mentioned in the Daily Wrap last night that Transports are starting to show cracks and are going to end up being a nice short.

Lets take a look, I suspect the general tone of transports is probably not too far off from general market (Dow Theory as antiquated as it is with Industrials and Transports).

 This is the DJ-20 (transports) daily chart, there's been a strong trend, earlier we had a much more bearish looking candle, but the volume just wasn't there, I suspected it wasn't going to stick.

The back of this trend looks to be clearly broken, this 60 min chart shows the distribution, as far as confirmation...

The same in the 30 min chart

The intermediate 10 min chart and here's where it starts to get interesting...

The 5 min shows a good timing turn, however I suspect this will go positive to make 1 more run, perhaps a new high or just a larger rounding top. Here's why I suspect that...

New divergences will always start on the fastest charts, here the 1 min chart today is leading positive off the lows after having gone negative and dragging down price.

Here we have the same on a 3 min chart, it may move to the 5 min, but overall the longer charts are what matters.

Strategically Transports are set up for a decline, from here we just need to look for a tactical entry. We should see a move higher in transports based on these intraday charts, it should be a short term move and because we already have such large negative divergences, we should see these intraday charts go negative on a move higher, that's where we want to enter.

That could be a bull trap above recent highs or it may be in a larger rounding top, but I suspect a higher high and that's where I'm setting my alerts. IYT would be my choice for a short, I'd keep this on the watchlist because it's close and it looks great.

Looked at FB for Earnings

At first FB had some pretty nice intraday charts, they look better than the overall market, however as I got to longer charts, the damage there was obvious. FB may be good for a rip and dip, but it's just not strong enough for me to take on as an earnings play.

Closing AAPL Dec. $535 PUT

I hate to do it again and I'm leaving all 2-3 leveraged shorts on, but I just don't feel right about AAPL just yet, maybe a day or so, I'm just not taking the chance, basically exiting at break even again.

PCLN Update and Example

The last update for PCLN was this Monday as I saw somethings last week that grabbed my interest, here's that update, you might want to check it out to see what our expectations were and how things have developed since then.

I'm just going to jump in to the charts and show you some of the expectations from the last update and where we are.
 This is the daily PCLN channel and a few breaks with normal behavior after the upside breaks, then a downside break on some volume, this use to be a short sellers signal, either here or on a test of the bottom of the channel that broke (former support) and they'd be looking for that to act as resistance. 

I almost always expect a move back inside the channel as a shakeout move before any serious decline will take place and although it wasn't the biggest break, there seems to be a LOT on interest in shorting PCLN.

As for the money flow or underlying trade, MoneyStream shows an area of ditribution in 2013 and actually a bit before.

The daily 3C chart shows distribution in 2013 and also a bit before.

The 30 min chart shows the same triangle that was forming earlier this week, volume looks right, it's a symmetrical triangle.

For technical traders a sym triangle has no inherent bias, it depends on the trend immediately preceding it which was an uptrend so it is expected to be a consolidation (sideways) / continuation (up) price pattern.

You may recall, my thought and alerts are set for a head fake move out of the triangle and above $1100 and its that area I want to look for the tactical short set up as it's a better entry, lower risk and if distribution is confirmed on $1100 which is a psychological magnet, then we have a head fake and high probability timing as well.

There could be a shakeout on the downside of the triangle which would probably get a little short squeeze to help it move up once they were caught , but so far today it has held right at support. Ultimately expectations were for a move >$1100 setting a bull trap and down she goes.

 The 60 min 3C chart shows crystal clear confirmation on the uptrend and then very clear distribution at the red box.

 The 15 min chart has more detail, but still good confirmation on the uptrend and clear distribution in to the triangle area, the only thing it's really missing from being a text book short is a bull trap / head fake move.

This is the 3 min 3C chart leading negative so maybe we see a shakeout below the triangle, if shorts jump in and prices move above the triangle's apex, they'll start to cover and that will give PCLN a boost, once it hits $1100, retail "Should" take over and do the work from there, but they are less and less in the game it seems or perhaps it's that they are some of the only ones left in the game.

I intend on leaving alerts in place, I'll pout one for a break under the triangle and a break back above its apex just in case, for now I'm still looking for $1100, but I think even with a strong stock like PCLN you can see things are coming undone, I just don't want to say this is it, this is where it all comes undone because there's some unfinished business here and there.

By the way, the Trend Channel Stop is at $1,000, how convenient is that? Can you imagine the stops at $1000?

All of Our Positions Are Moving the Right Way

This is a bit strange, sometimes it takes a goof 30-60 mins. for a knee jerk trend to get together, sometimes it's over by then. The initial move on the F_E_D release was right to VWAP...
ES 1 min chart moving to VWAP right after the F_O_M_C and then down.

We expected the $USD to bounce, it is up, we expected Gold and gold miners to see a pretty significant pullback and they are both down. As you know I've been looking forward to buying TLT at $100-$102 and even opened a TBT (2x short TLT) expecting the pullback, TLT is down, the TBT position is up, as far as the broader market, down as the signals have been showing.

It's way too early to make any kind of assumptions, but I am kind of breathless that every asset we thought would move in a particular direction based on 3C charts is now moving in that direction.

I'm going to try to check breadth and see if there's anything to this short term

Quick Update

This market is going to move faster than I can capture charts and post, but this is what the SPY and QQQ, which were the only two really with intraday positives, still very small, the IWM has stayed negative even intraday the same as the futures.

The difficult task here is to show the intraday charts without misleading about what their longer trends look like, SPY 1 min intraday, this is a very weak divergence and very new, in fact as mentioned above, if I recaptured it again right now it would be run over and leading negative intraday now.


So far this 2 min is holding up still...


 pretty much all activity stops at 3 mins, this trend is much worse than it looks, but I'm trying to deal with intraday, Post F_O_M_C signals so no strength to 3 mins.

The QQQ 1 min, very weak and young, already run over....

 However this 2 min, is still in place so I wouldn't make judgements just yet, it's too early, but these 2 min charts holding are interesting and suggest the market is trying to put something together.

 While the 3 min is leading negative and in a big way, the intraday if zoomed in tighter is also in a positive divergence here.

At 5 min there seems to be no hope at all right now, still intraday negative and long trend negative.

The IWM 1 and 2 min charts are in line with price, but the 3 min "may" go positive, it hasn't locked in yet.

Give the market some time to settle and some trends to lock in.

Meanwhile I hear NASDAQ has declared self-help so just another sign of what's going to happen when the stuff really hits the fan, markets locked up and shut down.

I'll bring you more as I have it.


Several good intraday indications for knee-jerk up

It started with the ES and NQ futures 1 min chart, then the move in QE sensitive assets, gold and $USD, now we have intraday positives in the SPY, IWM and QQQ.

The MSI looks to have lost some momentum so if you wanted an intraday trade, I think a knee jerk move on the upside would be it, but that' even too risky for me.

Several QE sensitive assets moving toward a move up

specifically gold and the $USD

Quick Intraday Update

The intraday SPY is more or less in line, the QQQ is leading negative, but more or less close to in line, the IWM is very similar to the Q's.

What is interesting is ES and NQ (SPX and NDX 1 min futures), they both have leading positive divergences, not TF (R2K futures).

If I had to guess on nothing but those charts, I'd say "Knee jerk reaction to the upside", after that however is when things get sorted out and it can be used effectively as a tactical entry.

Just letting you know what I see.

AAPL Charts

Here are the relevant posts for AAPL yesterday, Closing the Puts... then AAPL Correction and Price Levels and finally, AAPL Follow Up

 It's this 60 min chart and the 30 min that looked similar that bothered me for anything other than a short duration position, I'd still wait on a core position until  that 60 min is really off price.

However recently the 60 min went negative at an area which looks like a head fake move in the reversal process.

This would have had to come from a stronger 30 min chart.

 And there's the 30 min chart, no longer in line, strong enough to migrate over to the 60 min. Also a strong divergence at the same place, the gap up after earnings, a perfect bull-trap/head fake area.

The trend in AAPL 15 min from accumulation to a leading negative divergence.

It was the positive divegrence all day yesterday that caused me to close ,the puts, intending on opening them at a better price as I just did, the volume uptick at the lows looked like a short term intraday upside reversal, it was.

Finally on a 3 min chart, none of this is there which tells me it's likely not that strong (yesterday's positive), so I feel better about the Put today.

I did make it spec size and left room to add just in case on a knee jerk move with distribution.

Trade Idea: AAPL Dec. $535 Puts

Yesterday I closed these at a bit better than break-even out of an abundance of caution and because I thought I could get them cheaper today, Had I closed them today I would have taken a 9% loss currently rahter than a slight gain.

I will get charts up of AAPL, but my main concerns were the 30 and 60 min charts being so strong or at least in line with price, that's not the case anymore.

This is EXTREMELY speculative and will be treated as such, right before the F_O_M_C, BUT I'M USE TO THE KNEE JERK REACTION, I KNOW THAT I'M NOT LIKELY TO PANIC IF A KNEE-JERK GOES AGAINST ME INITIALLY, MAYBE I'D EVEN ADD ON IT, YOU HAVE TO BE COMFORTABLE WITH THAT KIND OF RISK TOLERANCE.

I'VE SEEN THESE KNEE JERKS REACTIONS AND HOW THEY ARE MOST OFTEN WRONG FOR A DECADE, THAT'S WHAT MY CONFIDENCE IS BASED ON, REALLY THIS IS A VERY INDIVIDUAL DECISION.

I will go with December $535 Puts... Charts are coming.

Last Pre-F_O_M_C Market Update

I'm looking around closely today at intraday action to see if there's anything very odd sticking out, but in reality, the very odd behavior sticking out started Friday Oct. 18th and has recently accelerated this week, that's my final pre-F_O_M_C take and I'll likely be looking at trading assets from here out while keeping an eye out.

Intraday there's nothing too exciting about today except in a few places, it's more that recent trend. I wouldn't feel very good right now being long, these trends are just too clear. REMEMBER TO WATCH OUT FOR THAT KNEE-JERK REACTION, MOST OF THE TIME IT IS WRONG.


Shorts in the heaviest R3K shorts are doing great today, but it's the trend and the action today that is notable.
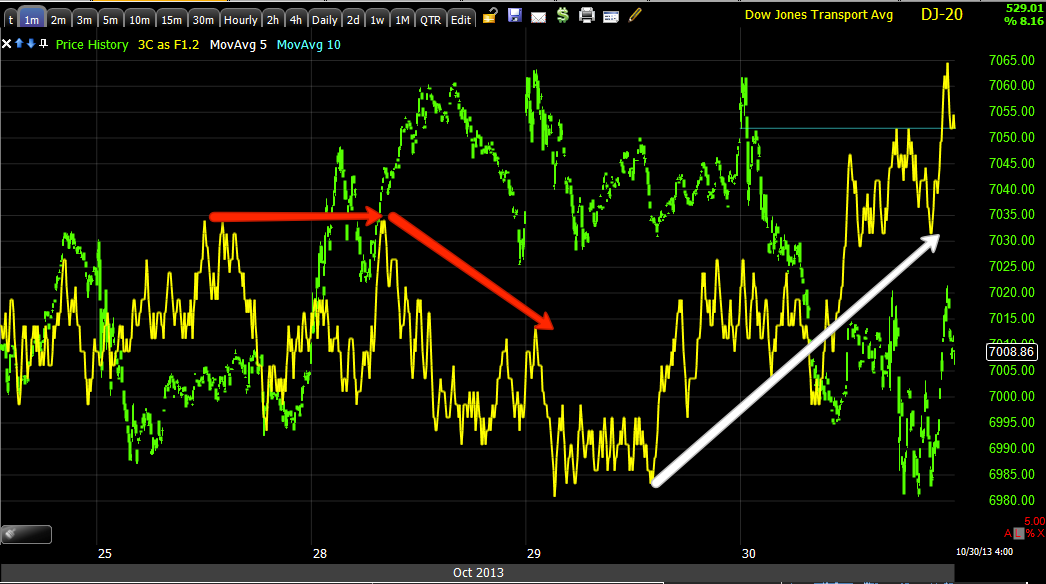
 THE RUSSELL 3000 Most Shorted Index held with the market then started falling like most every other indicator and today, well you see what's going on today, nearly 5 days of gains wiped out this morning alone.

 It's not been the intraday 1 min charts that have been interesting, it's the slightly longer like this SPY 3 min chart, again the last several days with a real change in character.

The QQQ, and this chart is even worse zoomed out, it's just the most definitive action is here.

 The IWM and look at the range, that's where we usually find distribution.

It's funny as I talk to some other people, shorts are upset the market is slowly melting up every day and longs are upset that the market is slowly melting up everyday with no solid gains, volume, or follow through and the averages dispersed.

 Yesterday and today's NYSE intraday TICK which barely made it out of the +/- 750 range and is clearly trending down today, more stocks are ticking down than up as we move through the day.

This is my custom SPY/TICK indicator, focus on the histogram at the bottom and...

For the trend since the 9th, it was up as it should have been and then flipped.

The UVXY (as many thinks it tracks better than VXX) or VXX  both have the same recent trend, but you didn't even need 3C to see it, just compare it to the SPX.

Here I inverted the SPX's price (green) so you can see what the normal correlation would look like, but VXX (Short term VIX futures) seems to be well bid today.

The actual VIX futures are not only strategically positive on a 60 min chart, but tactically as well on the 5 min chart above.

 Credit or at least HYG which is a SPY arbitrage asset and therefore subject to manipulation had me concerned in 1 respect, that was the long term 30/60 min charts, even recently I posted some changes, but still concern. All of the sudden the 60 min chart is clearly negative in the closest thing to a range HYG has seen, all of the sudden I'm not so concerned anymore.

*If I wanted the extra exposure, I'd consider HYG puts here.

 HYG 60 min transforms from in line/ trend confirmation to distribution.

And the cycle off 10.9 with accumulation at the lows and strong distribution which was the first thing I picked up on, that Friday (Oct 18th), the 1 and 5 min charts leading negative quickly.

 Yields have broken down again today, they tend to attract the market toward them, but are a great leading indicator.

On a longer scale, a positive divegrence in Yields at the 10/9 lows and a deep leading negative now.

On an even longer scale (that's why I showed the chart above because the positive above almost disappears here, we have numerous leading signals, none worse than the current one.

Even commodities as I've been pointing out.

Finally, the Black Swan Index of the CBOE's SKEW, I think we were the first to cover it even before it shot up as the ROC changed, now it's quite elevated indicating an increased probability of an improbable event, a market crash or black swan.

I have to say, I don't see a smoking gun intraday except the MSI above, but I think there's been one looking us in the face all this time in every daily wrap since the 18th.