Friday, August 27, 2010

Short Term Profits

I was just made aware of the TRIN being at .53, this usually will mean a close lower the next trading day, that is not uncommon in a bounce, but there's a chance and I wanted to let you know. It doesn't in itself mean the bounce is over, just Monday has a piece of the puzzle suggesting a close lower.

I get a little help from my freinds

keeps playing over and over... look at what happened to that divergence I showed you in the last post...

It turned into a leading divergence. It's leading because price has not yet attained the highs we see in the middle of the chart at $106.80 or so, but 3C is at a new high. That's called supporting the market.

Possible intervention

Red=negative divergence, white=positive. It's not the strongest divergence and again, I'm really getting microscopic on this, but it's possible intervention to support price. This is not the kind of strong, obvious divergence I'd bet the house on.

Hopefully my typing will be faster

I suspected this triangle, it hasn't failed yet, but I'm not getting good 3C signals and I'm guessing it's because the market is not being run right now by anything other then "dumb money". So I switched over to the Tick Index...

In white is the SPY, in green the tick index. You can see to red trendlines which show the SPY triangle and then the breakout, tick should have headed higher, it didn't (red arrow), however, there are the first signs of a possible positive divergence here (white arrow). Any of you who have TeleChart of StockFinder can watch this too, just go to symbol "$TICK" and put in a comparison symbol like the SPY or whatever average you choose. As I write the Tick index looks to be carrying on the positive divergence. I'll keep watching 3C as well for any sign of institutional or MM support. As I said, their strategy seems to be clear, but tactics are always a question.

So I don't Blow This Out of Proportion

This is a very robust 30 min chart. As I said last night, a 30 minute chart with a positive divergence can create a rally like July, I'm not saying to expect that, just making the point it's important. Between 8/17-8/18 the negative divergence (relative) pushed prices down to their lows. Accumulation can bee seen here on 8/24, again below Dow 10k on 8/25 and again today. The divergence now is in leading position so overall, despite the intraday bumps and dips, we still have a healthy looking bounce ahead. For 3C users, there's also a negative divergence between 8/19 and the opening gap up on 8/23.

Sorry I can't type faster.

There's the triangle, there's the breakout as I was typing the last post. Note volume is curious, the red spikes should not be there and the breakout should have more in the way of volume. It's possible/probable that is retail short activity. Smart Money will support the market if they feel it's needed, but right now they are counting on retail to create that momentum-especially this am's shorts under Dow $10k. I'd suspect they'll come into the market at some point and cover, I'm not sure we have seen that yet and may not until the gap is filled.

Watch for a retracement that does not fall below the triangle, it should be on lighter volume and then a push to new highs-hopefully on heavier volume and then we can put the question of this triangle behind us. Remember, this is kind of knit-picking.

Watch this triangle

There's a small intraday triangle from about 2 pm on, it's obvious and I have a couple of 1 min charts showing a negative divergence. Watch for a break below, we want to see that recover quickly to a break above, otherwise they may be setting up an afternoon sell-off, perhaps with a rally into the close.

3C can give "fuzzy signals" in a congestion/consolidation zone, as most indicators do. I checked the more robust 10 minute which is devoid of the intraday noise and it appears to still be on track in confirming the trend, but a little low compared to equivalent past price levels. This may be a function of the fact that there is little accumulation occurring, that was already done. What we want to be on the watch for now is the signs of selling or distributing and i can't see that on the 10 min as of yet. A breakout north of the triangle that holds will probably pull 3C up to appropriate levels. However, as we talked about this a.m.-obvious patterns are easy targets to take out. So watch for a breakout, good volume wold be helpful. On the SPY, it will be around $106.70.

An afternoon retracement is not something to get worked up over, they are common especially as day traders exit the markets. The close is what will be meaningful.

Managing the Oil Trade

Really the concepts here can be used to manage any trade, you just have to find what works and what works for you. Unless something major changes, I always try to stop out of trades on the close, there's too many intraday games and you'll be knocked out of the trade like with the false break down this morning.

Above we have a large bull flag which is an upward continuation pattern. I tell you, when something is obvious to you on a chart, it is obvious to most traders and certainly the mrket maker who specializes in that stock, all day every day knows it better then anyone. The market maker also knows where the stops are, both because of the pattern and where hundreds of technical analysis books have taught technician's where to put their stop in a pattern like this and because the market maker has the order book at their disposal. Just about any order entered with a broker is in their book. So they run the stops, just like we saw happen yesterday when the Dow broke below $10k and this am as well. So you have to be aware that this is always a possibility, a false move. Now that the flag has broken out to the upside, in part propelled up by my "Judo Concept" , it's time to move your stop up to lock in gains and not let this turn into a losing trade.
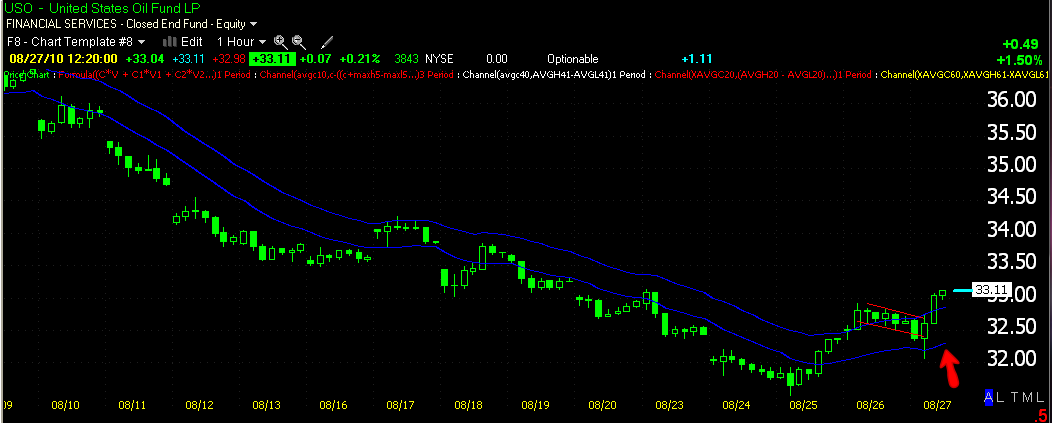
My Trend Channel that I wrote is a very good tool for this, but you need TeleChart or StockFinder to use it as that is where I wrote it. If you want, there is information at the very top of the site on both programs, I'll be happy to share the Channel with you. Right now, the highest point of the lower channel line represents the stop on a market close, it will continue to move up as long as the stock does.
Above is a tool you can find in almost any free charting software called an Envelope Channel, it's not as good as my channel but it can work. You can see the settings and the timeframe on the chart. This is another possible solution. Feel free to contact me with any specific questions.

Update

There was a small negative divergence at the highs a few minutes ago. The 5 min is in an improving leading divergence.

A bit early, but...

I don't know what CNBC usually sounds like, but I'm hearing the market being pumped a bit, I'm hearing them talking about moving into S&P stocks for higher yields then bonds, I'm hearing that Berenanke's speech was pretty much the right balance at the right time.. it sounds like Wall Street's spokesman are pushing this as a positive event, which is what I expected to hear under my scenario.

The market is now positive so it took the revision news in stride and seems to taking the bait. The fact the market hasn't sold off is telling us something in itself.

We are positive and close to new highs. There are plenty of leading divergences in the 1-5 min 3C charts right now.

Unconventional Measures?

That may be what main street will buy, and that which Wall Street knows to be a joke.

The Fed released 3 things they can do to stimulate the economy, none of which seems unconventional at all. It's if the Fed is implying, without saying, they have a secret weapon, something no one has thought of, an "unconventional approach", however as I said, the 3 measures laid out were far from unconventional. This is what I was looking for, something that bolsters the confidence of the ordinary Joe in the market, but something Wall Street knows is nothing more then a shadowy, vague set of words. We could have our spark that ignites our bounce.

Since I refuse to, anyone watching CNBC, let me know what the climate is there, how they are spinning this story, especially as it relates to speculation regarding unconventional.

Ahh I guess I should do my job and put on CNBC-just remember though, I'm doing this for you.

It takes me time too


Here's the DIA with the start of what could be a leading divergence.

Update

I think the failed gap, plus a break below 10,000 was blood in the water for the shorts. As you can see, at 10:03 we got a positive divergence. The first story I've seen out of Bernanke's speech was 10:07 although it broke earlier obviously it takes time to get it out so I think that had something to do with the timing of the divergence.

I'm surprised so far, what's he's said doesn't seem to be anything more then, more of the same. We'll see what else comes out.

No Surprises Here

As usual, the a.m. retail gap up has been faded, the red arrow shows that clearly and we had a small white arrow divergence sending prices briefly higher from there. Remember though, if my assumption is correct (and so you know, I hate making these-I prefer rock solid evidence) then we won't see the catalyst for a rally until Ben's statements are released to main street, so don't read too much into what we are seeing just yet.

In the World of Wall Street Lollipops Taste Like Rotten Fruit and Rotten Fruit Taste Like Lollipops

The GDP was revised down as mentioned to an astonishing 1.6% from the initial 2.4% and that's good news, the market looks set to open higher! That's because economists (they're worse then weathermen-sorry if any of you are weathermen/women) expected a worse reading. However, just stop and think about that, from 5% to 3.4% to 1.6%, that's an alarming trend.

In any case, we are in Mr. Wonka's Wall Street and the pressure is on Bernanke to ratchet up the rhetoric. Wall Street knows and has known, their not waiting on Bernanke's speech to make plans, but Main Street is and the Administration is. The public is a panic that things are going to actually get worse is going to actually make things worse so Bernanke is going to have to pull out a remarkable speech to turn that tide, even if it is meaningless. This was the thrust of my reasoning behind what we are seeing in 3C. At 10 a.m. MR Bernanke starts his speech, watch for Wall Street's reaction because from what I understand it will be behind closed doors, at least fora bit.

Honestly though, consider what our core strategy is, it's not a bounce, but a bounce will help it. Now consider the state of the economy after every kind of stimulus you can imagine has been unleashed. Can you say Double Dip? I can even spell it D-o-u-b-l-e- D-i-p and the world will be right there with us. Again, this is why I tell you, we have an opportunity perhaps not seen in our generation to operate in a market that few will play in and far fewer will understand how to play in. The Wolf Pack is gathering, the full moon is rising, the scent of prey is in the air and the hunt is beginning. Welcome Wolves,  to Wall Street.