Wednesday, August 24, 2011

If I had to guess

I would say one of the tightest ships on the ocean sprung a leak today about Steve Jobs. It isn't often we get to see inside action on AAPL because of how tight they are, but I would guess this was inside action in anticipation of the announcement tonight.

It's like 3C and price are two opposite magnets.


As For Gold/GLD

Like I always say, we can see what they are doing a lot of the time, but have no idea why they are doing it and they are much further along the information curve then we are. This is apparently why Gold has been in distribution over the last week or so, CME hiked gold margins by 26% and two weeks ago hiked them by 22%. Plus the Shanghai margin hikes, like I said, market manipulation is going global as these exchanges are bought out. So we weren't crying wolf over nothing and anyone who listened over the last two weeks probably isn't down on their GLD position tonight.

Jobs Weighing on the Market

Steve Jobs resigned tonight as CEO of AAPL, here's the resignation letter. Tim Cook is taking over as CEO, but shares of AAPL are down over 5%. Since the NASDAQ re-weighted a month or so back, I don't know what AAPL's weighting is now, unless we all chip in for the $10,000 to pay NASDAQ to find out. However, last time I worked on figuring it out, it was about 20% of the NASDAQ 100 or about equal to the 50 bottom NASDAQ 100 stocks combined.

Oh, I forgot to mention...

Of the 239 Morningstar Industry and Sub-Industry groups, 199 closed green.

Some Quick Observations

This isn't the wrap, I have  lot more work to do before I post that, but quickly...

The Dow-30 ended + 1.27%
The S&P-500         + 1.32%
The NASDAQ 100 + 0.73%

That makes sense when you look at the sectors in rotation today.
Financials were strong, thus the S&P did well, Industrials were strong and the Dow-30 did well, the laggard was the NASDAQ 100, and look at Technology in the red box, it dropped off today.

The dominant price/volume relationship today was price up/volume down, this is usually considered to be the most negative of the 4 relationships. I'll have to look at the market action a bit more though before I attempt to put it n context. To demonstrate the dominance, the Dow-30 has 26 of 30 in this category and the NASDAQ 100 has 67 of 100, so it was dominant.

The thing still nagging at me is the analysis by Wall Street being repeated everywhere that the Jackson Hole event is a no win scenario for the market. If Bernanke announces QE3, then it will either be too small or it will admit how bad off the economy is, if Bernanke says nothing about QE3 then the market falls because it is already priced in. Remember where this analysis originated, it's just being repeated by the financial media and everyone else. I will point out that before the last FOMC meeting, even the most raging bears, like myself, were saying Bernanke would announce some measures in an emergency meeting before the FOMC meeting. Bernanke said nothing of QE3 and basically admitted defeat, I will remind you, the market went on to bounce from that point.

So I'm not picking sides right now, I'm just gathering pieces of the puzzle and seeing what picture emerges.

I'll be back in a bit.

NASDAQ to Lead the Breather?

1 min QQQ

Next Stop...

Earlier I today I showed you the resistance levels, one was just taken out, as I said earlier, gap resistance is some of the strongest resistance, that also happens to be the next test for all of the averages.
3C will really need to be inlne to get through this one, maybe we see a breather first before an attempt.

SPY Update

 As mentioned in a previous update, the SPY was moving to test resistance, I said I wanted to see volume pick up and look at volume as it broke through resistance.

 Here's the 5 min chart to give you a better look at volume.

 I also mentioned that the other averages (in the WM post) were getting in line starting with the 1 min charts, this one is in line

 The 5 min chart is nearly headed vertical, so it's trying hard.

The same with the 10 min chart, note also the stage of accumulation, confirmation, a consolidation and apparently it looks like it's trying to jump back into confirmation on a new local price high

USO Change of Character?

 The USO 10 min chart indicates a more serious pullback, however...

 The 5 min chart is nearly in line.

The 1 min chart shows more detail of when the negative divergence started and a positive or new divergence has to start somewhere, that will almost always be on the shortest timeframe first and work it's way up to the longer timeframes. That being the case, the 1 min chart has been working on a positive divergence for most of the day, plus t just went into lading status.

IWM Jumps Inline

Other averages are getting their 1 min 3C chart together, but the IWM jumped in line in most timeframes really quick.
 IWM short term is now leading

 IWM 5 min is close to leading

And the 15 min is in leading position for the entire bounce since 8/10

SPY Test

As I mentioned earlier, the SPY needs to take out the $118 level on some volume to get momentum flowing again. As you can see it's headed for a test of the $117.80 or so level and volume is picking up a bit.

RIMM Follow Up

As expected in numerous posts including today's, RIMM is breaking out above the trading range

Id like to see some decent upside here, then we'll start looking for the short entry as this will almost surely end up as a false breakout.

Trade Idea VXX (Short)

I look at this one as more of a swing trade (short) and I'd prefer to use options, but I WOULD NOT hold them until expiration.

There's good alignment between the timeframes showing negative divergences. Remember also that VXX trades inversely to the market.

 VXX 60 min

 VXX 30 min

 VXX 15 min

 VXX 10 min

 VXX 5 min

VXX 1 min

Trade Idea HOV Part 2 (long)

HOV was an earlier long trade, it has pulled back and looks like it wants to move up again soon.
 HOV 15 min chart with the first wave of accumulation and then distribution, the pullback and now a second wave of accumulation.

The 10 min chart confirms it. The 1 and 5 min aren't in line yet, but HOV is starting to trade laterally, that's when we often see accumulation. I wouldn't be opposed to a position here with an initial wide stop. Remember because of its price, HOV s a speculative trade and risk management should reflect that.

Transports Cont...

I just took a quick look at FDX, and the charts are nearly identical to the Dow 20, I'd have that one on my radar.

Transports Look AMAZING

 DJ-20 60 mn chart, that's a huge leading positive divergence.

 This is what I expected and still wonder if the broader market will do, a head fake new low on a "W" bottom, look at the relative divergence between the first low and the second lower low!

 The 15 min chart is even more amazing, and it's in a leading positive divergence.

As is the 10 min chart.

I'd definitely be looking as some transports...

Miners Trading System Update-Long Dust

A Long Dust signal was executed yesterday morning on the open.

 Here's the long signal, up about 9.6% in 2 days.

 Here's the long term 3C accumulation signal, it looks like DUST has more upside, but I think it will be rocky.

 The 15 min 3C chart

 The 5 min is starting to signal a pullback.

 The 1 min is signaling a pullback now. Remember the bounce I thought we'd see in GLD, it will probably have the inverse effect on DUST.

We are at some resistance, I would think we'll pullback at least to the 50-bar ma on a 60 min chart. You may want to take profits here and re-establish a position on a pullback. The longer term charts seem to indicate that the DUST uptrend ill last for a while, but as I said, will be a bumpy ride.

Market Update

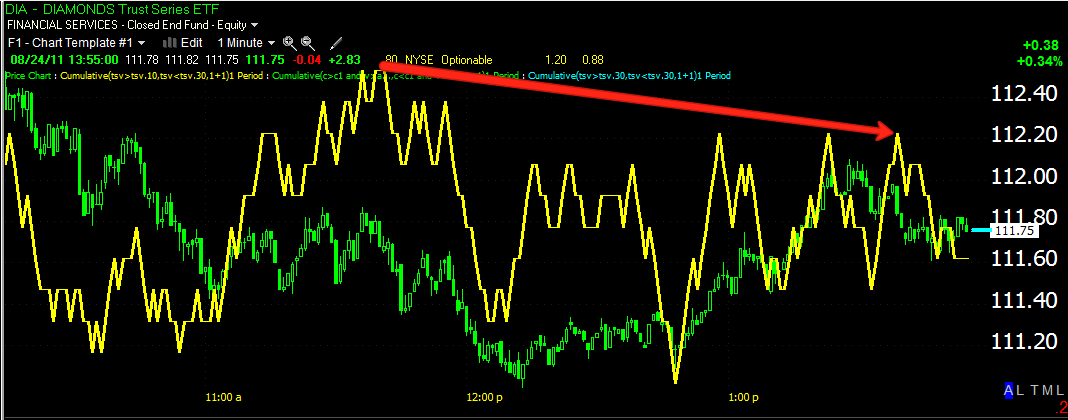
 DIA 1 min negative relative divergence

 DIA 5 min negative, relative divergence

 DIA 10 min mostly in line right now.

 IWM 1 min -a small negative divergence off  nice positive divergence on the earlier dip.

 IWM 5 min, I would say this is close to inline, but comparing the relative points in the red boxes, theres a relative negative divergence.

 IWM 15 min Leading positive divergence, making new highs.

 QQQ 1 min somewhat negative divergence, but it's difficult to say because price and 3C are still moving up and lower then the relative point being compared to.

 The 10 min QQQ is short of the same, but it is clearly lagging a bit more.

 The 15 min must be called a negative divergence

 QQQ 30 mn Positive leading divergence

 SPY 1 min better than inline-leading positive divergence

 SPY 5 min also difficult to call a negative divergence because of the positioning, but it i lagging a bit.

SPY 15 min , leading positive divergence, at a new high

Today seems to be a consolidation day of sorts, the SPY needs to break $118 on some volume to get momentum flowing again.

Gold and Silver Update

It looks like gold and silver (gold a bit more) are going to stage another bounce / consolidation. In certain instances where you have a decent profit, I might consider taking some of the profit off the table and trailing a stop, you can always add on the bounce failure.

 GLD 1 min

 GLD 2 min

 GLD 5 min-this is the one that has me thinking it may be a decent bounce.

SPY 5 min, also seems ready to correct a bit, however, GLD should see a bigger correction.