Friday, September 3, 2010

Major Post Coming... Don't miss it

False Breakout


OK, I'm going to give your inbox a rest for now before you report me for spamming. This appears to be what we've been looking for. We'll have to see how it reacts at support levels and watch the volume

Another Piece of the Puzzle

UUP which has drifted down today is also showing a leading positive divergence here on the 5 min chart-to refresh your memory, 5 minute charts are the earliest timeframe that institutional activity is observed and in a change of direction, it's one of the first places you want to look.

Here's the UUP 1 minute chart (market maker territory) and note the positive leading divergence there-also note it started around the same time as the rally in the market. Remember, typically the dollar (UUP used as a proxy for intraday information) runs inversely to the market

Shift in character


This is the first major shift in character we have seen since this run up started around 11 a.m. It is a negative 1 min divergence. The current position of the last 3C reading is also negative and lower. One of the tricks they use to snowball a decline is a false breakout. Clearly a resistance area has been formed around the $110.80 area. A failure of a breakout above that is one of the tricks Wall Street uses to create downside momentum. Watch for volume at support levels and obvious areas such as the triangle breakout areas and whole numbers.

Update 3

Remember the post about the "Friendly Trading Environment"? When patterns act like technicians/traders believe they should and how we know in reality that often they break these patterns, but they had not the past few days. You see a clear ascending triangle, it has a typical expectation of an upside breakout-we got that with volume, no fooling around with it, then a continuation triangle, again no fooling around with it as Wall Street usually does. Like I said then, I'll say now, they've created an atmosphere that is welcoming traders and making them feel like they are making all the right moves as patterns act axactly as they have learned them and prices move higher.


This 3C has worked well with positive and negative divergences, you can see into this "Friendly trading environment" we have negative divergences, institutional selling into higher prices, though this is a 1-min chart which is the timeframe of market makers. This would suggest that market makers are closing out their long inventory and or going short into the rising prices. It's kind of like a trap, "Come on in" and then the door is shut in your face leaving you holding the bag. That's the impression I get here.

Wy back when we first talked about a malicious bounce, the purpose was to squeeze shorts out, draw in longs and then pull the trap door. Longs are at a loss and sell, shorts jump in and we get a snowball effect. This chart has been extremely accurate in the past on the 5 min SPY. It has shown the initial positive divergence or accumulation that took place at the white arrow to kick this move off, and since, there's been negative divergences suggesting they've been selling and shorting into the entire move.

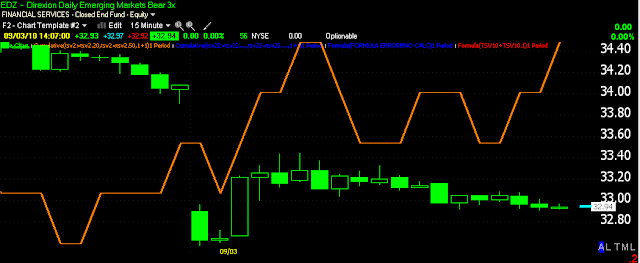
Here we have a long position that is an inverse long-meaning a short on emerging markets, it's under heavy accumulation down here as this 1 minute chart shows. This is a substantial timeframe for Here's the 5 minute-we see the same thing activity.

Here's the 1 minute where market makers operate. Before a big move up they need to stock inventory to sell at higher prices, that appears to be exactly what is happening. A move up in EDZ would suggest a move down in the market. I think we are getting very close and personally we will be buying EDZ here.

Update 3

UUP is in sync with 3C-there appears to be a small positive divergence, this would be normal intraday volatility unless it continues to develop.
USO is seeing a little bounce off a relative positive divergence on the  min 3C
Here are some signs for me, I would not go chasing this move.

GLD has filled the gap and appears to be putting in a negative divergence. Remember I'm bearish on Gold so I might consider using the strength to initiate a small short in GLD.

Update 2

Here you can see the opening gap being faded (sold off) and the positive divergence from 10:30 to just before 11 a.m. Now we have a negative "relative " divergence. Before making a strong reversal call I'd like to see 3C which is near the $110 level, break below the red line drawn around $109.85-that would give us a stronger leading divergence and more likely reversal to the down side.

And Here It Is... U6

This is probably the broadest measure of unemployment as far as unemployment's effect on the economy. The way the number is tallied for U6 data (and when you see it you will understand why it's not released) is the closest tally to the way it was counted during the Great Depression. The Great Depression topped out at 25%.

As you can see, U6 for August rose from 16.5 to 16.7-this time last year the numbers were 16.4-16.8 so you can see after a year, we haven't made much progress and the rate is headed higher. These are the kinds of things CNBC won't talk about and the government doesn't want to highlight. The fact is, it shows nearly 1 in 5 people who are unemployed or underemployed and that's important information. Here's where you can find the employment data.

The Mechanics of a Leak

Clearly the report is sent out, most probably to media outlets before it's release, the same as a President's speech, this how they are able to give analysis of the story so quickly, they already new what would be said, but it is "Embargoed", until after the actual event. I think Wall Street has a lot of friends in the media and a lot of money, obviously it wouldn't be too hard for them to get their hands on this information. Of course there's probably other avenues they have as well.

Click on the picture for an expended view

Update

Positive divergence for the run after 11-may still have some in the tank

This is a 5 min -the above represents market makers,this represents a blend of market makers and institutional money. There's clear distribution again today, first into the gap up and as you can see by the second chart, it's moving into a leading negative divergence.

Has anyone found the current U6 number released with the report today, I've been answering emails and haven't had time to look. I'd appreciate the link, especially if it shows last month's number.

The President's Speech

 Fell flat, below in the square is the time he was speaking

The most probable reason it fell flat was because all of the ideas he mentioned had already made their rounds through Wall Street, no surprise, so no surprise.

This isn't to knock anything he said, just to point out that Wall Street was already aware of all of this and it has been priced in. I feel there may be some things in the unemployment report that may be not so great aside from the headline number, I'm looking for a link now to look at the U6 data, I feel the market is more interested in that then the headline number which is largely for public consumption.

Remember, there are almost always revisions.

What took the wind out of the sails of the employment number was the ISM Index. A Reading of 50 is stagnation, below 50 is contraction. The number came in at 51.5 from a consensus of 53.5 which was down from July's number of 54.3, so it was quite a disappointing number and you can see a direct correlation between it and oil, look at what USO did at 10 a.m. when ISM was released. Yesterday I showed you the negative divergence in USO.

So it's back to watching 3C.

I think it's interesting, the charts I showed of Gold yesterday breaking down toward the end of the day and the heavy negative divergences there-another coincidence? I even posted an update "This may be it for gold".

Finally, recall the "Friendly Market Conditions" I mentioned and wrote about yesterday. I think today we are seeing why, yesterday was easy for smart money to sell into higher prices, this morning, other then the gap up, it's not been so easy, they'd be selling into consecutively lower prices.

As I try to point out, we can see the what, we just don't know the why until later. Some of the questions of yesterday have been answered today.

President's Speech Delayed... Indefinitely

Just Coincidence?

First 3C on the open shows selling into the gap up-this isn't telling us much as gaps up are typically faded by market makers, but also look at the negative divergence right before the ISM came out. IT may just be coincidence, but....?

ISM Index Comes in close to Contraction

Could This be on the President's Agenda

STORY HERE

PIR TRIGGERED

This is a breakout long on the list

President Speaks at 10:00 am

CROX

Long has triggered