Friday BAC and financials seemed to be in more trouble; with that kind of trouble, count Real Estate in the troubled category. It seems that the mortgage process from start -"predatory lending", MBS, etc to end: foreclosure process and now loan modification processes, are all under legal assault with the latest coming Friday as major banks received more subpoenas from the SEC.
From what I've read locally, court dates for banks looking to foreclose are being cancelled and from what I understand, these court dates are not easy to come by. Each law firm receives a monthly allotment-lets say 100 cases a month and it takes time to get their case into the system, then they are turning around and flat out cancelling them. I suppose they have good reason.
A second front was (for Friday alone) was opened up when Arizona's Attorney General brought suit against my favorite and Cramer's too (albeit for different reasons and different sides of the trade)... BAC Bank of America. This suit alleges that BAC mislead customers regarding the loan modification process and damages being sought are $25k per incident. Imagine that! Assume 40% of those foreclosures were condominiums which led the speculative bubble in real estate, assume the median price maybe somewhere around $50-$100k and they are facing 25% to 50% penalty on top of any other losses accrued in the foreclosure process.
Unless you agree with Cramer and believe banks are safe to buy here because journalists who are chasing the Pulitzer Prize know that the bank story is overdone, then by all means. I still think there's a lot of opportunity shorting banks and real estate (SRS).

Here's that bounce that was accumulated, (gave rise to the cover signal in BAC) and the recent, real quick distribution on the 15 min chart. I'll be looking at positioning in BAC short below $12, remember the last down trend gave up 35+% and lasted over 6 months. The next one could be worse, especially given Jullian Assange's recent warning to BAC customers to pull out there money and close their accounts and put that money, “Somewhere safer”. Funny that we actually closed our BAC accounts Friday, not because of this, just the horrible customer service and total incompetence of the branch and to some extent the larger institution. In any case, I'm sure you've heard, Assange has documents about BAC and I doubt they're going to be a fizzling non-issue.
Just like sector rotation in the stock market, we get regional rotation in the world, one week it's Europe, then China, South/North Korea, the U.S. and this week looks like it's going to be the Korean Peninsula once again. Tensions are heating up, which is causing some turbulence in Asian markets tonight including the stock market in Bangladesh that saw a one day plunge of -6.72% and that was accompanied by another recent theme that is in global rotation-RIOTS (don't want to forget the riots in Belarus either)! Other Asian markets also were feeling the tension as North Korea placed rocket launchers along its west coast, which sent an order for residents of the recently shelled Yeonpyeong Island to move to air raid shelters. This comes as the South held their preannounced artillery drills. Just to make the holiday season a little more interesting, the US put its long range strategic bombers based at Guam on special alert. Last update was that South Korean fighter jets have been scrambled, but the drills were completed without incident. So this week may turn up some unforeseen events-note I said unforeseen, it's always that which we didn't imagine that usually turns around to bite someone. In any event, this is effecting the Asian markets and it may effect the US equity markets as last time I looked, Dow futures were down about 33 points and S&P futures down about 3.5 points.
I don't know if you saw the after hours market on Friday, but most of the gains from Friday which were minimal to start with, were taken back down in after hours. The close hinted at this
Note the negative divergence in the afternoon-distribution? Then the close of 3C was at the low of the day, although price sat on support.
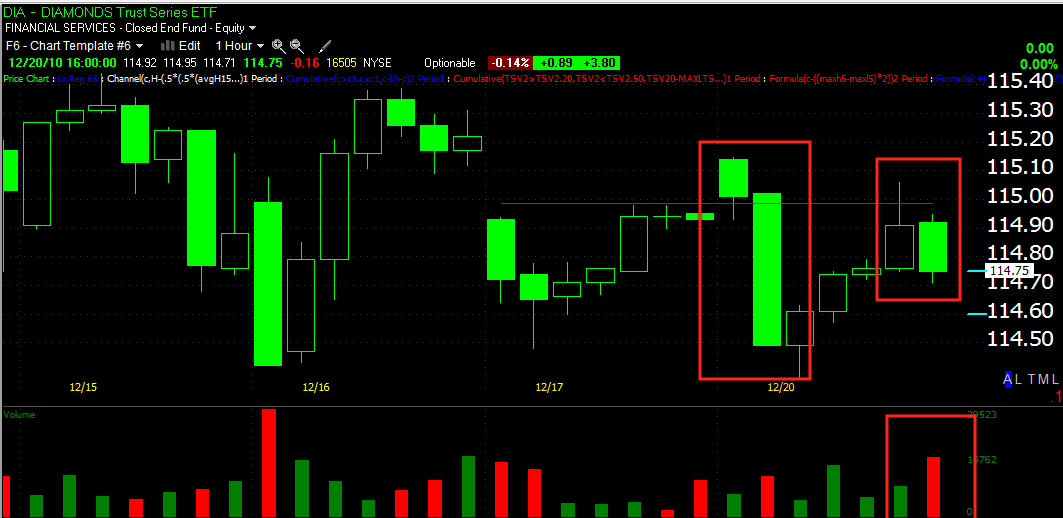
The DIA was a bit different, it didn't end on the lows of the day, but 3C did show about an hour of distribution before the DIA headed lower. Into the close we saw a ramp up to attempt to close at a new HOD, however 3C was solidly lower
Thus far the FX market isn't giving any clear signals or anything particularly useful with regard to US markets right now.
Other then a big plunge in the VIX which I showed you Friday, I'm pretty much operating on the 15 minute charts for direction.
DIA
QQQQ
SPY
Here are some interesting charts for the week ahead and today:
BCRX is a long idea. It looks a lot like it wants to break out of this base.
The daily chart above looks very bullish, the 3C pattern is consistent with a base building pattern and the pattern it has built is consistent with a breakout sooner rather then later.
XOMA is another long idea, there's a few stocks in the sector that are looking good. The big red volume may have been a shorter term capitulation event with a bit of base building and volume is surging here.
The 3C pattern also looks very constructive.
PEIX is another possible long, not only did it hold gap support, but the volume pattern for the advance and the decline look very constructive.
BGP looks like a momentum long play judging by the volume move. The pullback has held support.
It's a bit early to speculate, but this base may be bigger then it looks, a possible double bottom base, if so, then this could be expected to put in quite an upside move. I looked at a long version of 3C in blue just to see if that may be what is going on and it seems to confirm the idea.
AONE held support at the gap, it also showed an uptick in volume on Friday, not huge, but we are looking for subtleties like that.
This 5 min chart makes it look like there's a move up in the works coming soon.
This is a short idea, there are plenty of others that have been on the list or on the site recently, but this one is interesting for a few reasons, first, as you can see above, it's hitting an area of major gap resistance.
This chart is a closer view of the resistance level and two candlestick reversal formations, one (the most recent candle), a Shooting Star which is a bearish reversal candle, but being that the body of the star is in the middle of Thursday's candle's body, it also is a Harami reversal-two distinctive reversal candlesticks at resistance an look at the volume.
Also, 3C hasn't been on board for this recent run up suggesting it's been used to distribute shares and by the looks of things, that process may be over-onto stage 4? Decline