Monday, January 3, 2011

Looking Beyond the Gap

Morning trade and pre-market is always interesting. Hedge Fund managers and people even like Cramer admit that futures are heavily manipulated to influence the open. When I see a gap up, I don't automatically assume that it's bullish, in fact a gap up can set up some of the best reversal signals.

We saw some strong closes today, like AAPL on a daily chart, but an intraday chart reveals that all of the gains in AAPl were made in approximately the first hour an a half of trading, the rest of the day was lateral, so the daily candlestick which looks strong, doesn't tell the entire story.

Some charts that gapped up, however that gap turned out not to be such a great thing on the close....

VALE gapped up and held the gap, but in doing so created a nearly perfect "Evening Star" which is a reversal candle-to the downside.

DO also had a nice gap up, however, this turned into another reliable reversal pattern, a "Bearish Engulfing Candle"-another reversal candle to the downside.

M put in a "Shooting Star" reversal candle off the gap up.

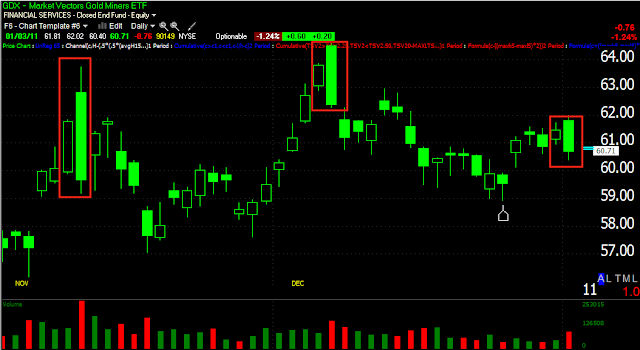
GDX gapped up only to create a very bearish engulfing candle. Look at the reversals that occurred after the last 2 bearish engulfing reversals.

As you can see, the nice gap up in WDC turned out to be a perfectly formed Evening Star Reversal Candle.

The point being, what you see is not always what you expect. You have to look closer, beyond the daily candle, beyond the headlines and look at the market. The market will tell you a lot about itself, unfortunately too many of us get caught up in the % gain, that's called pure laziness. Anyone with 30 seconds to spare can get that information. Taking the time to understand the breadth of the market, the stability of the move, confirmation, etc-will give you a better understanding of what comes next, not just what occurred today.

Here's an Example

MRVL which was just mentioned as a short sale candidate on December 30th had a nice gap up to work with this morning, here' what it did with that advantage...

The red box is today's trade in MRVL-took a gap up and thus far has turned it into a loss, which only reinforces my feelings about MRVL being a good short trade to take a serous look at.

Follow Up on Market Update

At 12:52 I posted the Market Update and showed negative divergences building in as the market neared its peak. I said we should see "downside/weakness from here"

Since then that's what we've seen, not a market just in full decline, but a market that lost momentum to the upside and started seeing distribution/selling. Here's the current 3C chart for the SPY.

It's not so much how much ground the SPY has given up since then, it's how much stronger the negative divergence has become since then that is concerning.

Many of the charts that I'm looking at have risen with the market as is usual, but standing alone, without considering the market, they don't look too impressive and as I told a subscriber in an email. many of them I'd even consider a speculative short on as the breakouts or moves up just don't look strong technically/3C.

SLV Update

SLV has broken below $30, we'll have to see where it closes.

USO, Another False Breakout?

There's plenty of charts today that are showing breakouts above resistance that do not hae the volume to back up the move, they also don't have positive 3C profiles and are falling in afternoon trade. This is a questionable day right now in my opinion. USO is just the next I've stumbled across.


Here' USO breaking out above recent resistance from December. Note the volume should be much higher at this point in the day for a solid technical breakout, it should be at least double or triple what we are seeing.

Furthermore, the 5 min 3C was negative right off the open and we saw the price decline from there, it continues to look negative and USO has filed the gap, so the chances of the breakout occurring on a strong breakaway gap have already been erased. The question now is will support hold or do we see another false breakout. If it's the latter, then USO could tumble pretty hard in a short period of time.

And There It Is!

Just an hour and a half ago I warned about SLV looking like it wants to test the $30 support, it's also why I have been tepid about a long Silver trade until this level can prove itself to be solid.

Here's the recent chart just taken.

I forgot to mention the false breakouts that we've seen for months around patterns like this triangle for our new members, those of you who have been here for awhile know to expect a bit of volatility and false moves around these patterns. In any case, in yellow, that's exactly what we saw, a false upside breakout and what happens to failed moves? they reverse quick and hard in the opposite direction. Look at that sell-off in SLV and this is a 1 min chart. Look at the volume on the sell-off and note the price level-$30.04 from an intraday high of $30.44. So the Silver battle between the vigilantes and JP Morgan looks like it's still on, this is why I cautioned to go easy into the trade-it needs to prove itself and today's performance in the afternoon is not inspiring a lot of confidence as of now. Also note in the last chart posted (click the link above to go to the last post) 3C was telegraphing this test with negative divergences.

MCD Still in good position

The market today has given MCD another shot at resistance, as they say, "A rising tide lifts all boats". There could still be some upside movement in MCD, the market will largely determine that as MCD didn't make it to today's 5th test of resistance on its own, it had some help from the market.

MCD testing resistance on a daily chart for the 5th time.

This is a trade to think about in longer terms, not so much in its daily moves. You can see a very natural progression of distribution on the daily 3C chart, until it went negative near October. Recently it' gone very negative, but nothing goes straight up or down and just like the false upside breakout in MCD above $80, it would not be surprising to see MCD above resistance if the market is strong and gives it a lift, it doesn't mean MCD and the players who have been selling it are not bearish on the stock, it just means an opportunity to sell at higher prices or short at higher prices is just plain good trading. Keep an eye on this one, I think in a few months from now MCD will be significantly lower.

The interesting thing about MCD and the next short trade, INTC is they are both bellwethers. Remember I said that toward the end of a bull move the cats and dogs rally, we saw that, the rallies are getting less meaningful each week, so the end of the cats and dogs may be near and that also means the end of the uptrend in the market may be near. MCD and INTC are major players and both are looking bad technically speaking.

Here INTC's daily 3C chart also goes through a very natural progression of distribution. The move today is breaking below a bear flag consolidation. This one is also in a leading negative divergence.


Here's an intraday 60 min chart, you can see the decline and the bear flag which has been broken today. There's good longer term distribution on the break of the flag. While the market is looking strong today, these are two, especially INTC that should have seen a greater lift from a rising tide, INTC is sinking into it.

Euro to lose ground?

It looks like the euro is going to lose some ground and the dollar may gain shortly.

 FXE Euro Trust

UUP dollar proxy

These are short term signals as of now.

RPC

Just triggered an alert at $1.14 which represents an area of resistance and a breakout from it.

EMMS

EMMS is another of the trades I set alerts on, it's flirting with a resistance breakout at $.84

GRO

Keep an eye on GRO, I have an alert set for >$2.07 where resistance is on a breakout from a decent base.

SLV Update

SLV is sitting in a consolidation pattern just above $30.00 which is support. We'll see if it can hold on, right now 3C looks like SLV wants to test that $30 level.

Market Update

There's plenty of upside this a.m. but the SPY just showed 2 negative relative divergences and 1 negative leading divergence suggesting we are seeing selling into this move higher, volume tend to confirm.

We should see some intraday (minimum) downside/weakness from here.

Interesting

INTC just triggered a swing trade short sale on a rather strong market day

More

BWEN and SNV just triggered breakout cats and dogs longs

More cats and dogs

NLS just triggered long

SIRI & GOK both triggered longs

ZBB Also triggered >$1.20

AMP has triggered a C&D long

S also just triggered a long

MRNA

Another cats and dogs long that just triggered. I suspect with all of the international markets up today, we will probably be seeing a lot more of these.

Trades

KBX and VLNC both just triggered Cats and dogs longs and URBN a short

BPOP and MMG

Both just triggered Cats and Dogs long trades. Still trying to get my softwate up , should be soon.

SILVER FINALLY OVER $30

NOW Silver looks like a viable trade. I'd still like to see it hold there a day or so, but for those inclined and who like the idea of the silver trade, now might be a god time to start building a position with a stop under $30.