Friday, July 27, 2012

It Just Keeps Getting Stranger

Earlier I alluded to the strangeness of the European Central Bank President out spouting off possible huge policy changes with his virtual twin, Germany, seemingly having no idea of what he is talking about and shooting down his ramblings.

Then we hear that members of the ECB seemed to got off guard as well.

Now the WSJ reports that ECB members are not backing Draghi proposals, that would be like Bernie saying the F_E_D_ is going to do "XYZ" and then all the voting members coming out on the same day and saying, "No we are not!" and just because Bernie is the president doesn't mean that it doesn't have to go up for a vote.

The WSJ summarizes the chaotic trade today as rumor/denial went back and forth, but suggested whether the market over-reacted today or simply mis-interpretted what Draghi said, the bottom line is, "one thing is sure. If the ECB does nothing next week, the markets will tumble."


What the WSJ is basically saying is so much "Hope" that the ECB will buy sovereign debt from the likes of Spain and Italy next week has been priced in to the market today, if there is no action next week (actual ECB buying, which they haven't done for over 5 months now), the markets will sell off hard. 


As mentioned above, even those in the ECB don't seem to back Draghi. Germany who has a lot more say than you think, obviously doesn't back Draghi, so that leaves what for a conclusion? Interestingly, that's almost exactly what our analysis of GLD/gold said today, it's what 3C has been saying the last 2 days and it's what we expected at a target level that was set BEFORE a move up even started. Essentially those in the know, don't believe and those who don't know where buying stocks today.


The closing indications for CONTEXT for the S&P e-mini futures (ES) said the same thing, those in other risk assets other than stocks were selling more aggressively.


The blue line is the close of ES for the week, CONTEXT just hit a new wide between the model and ES, meaning the risk assets that should rally with ES weren't and most of those risk asset are traded exclusively by smart money.


ES wasn't the only thing considered overvalued, SPY arbitrage player probably set up some nice trades today for a reversion to the mean.


This also got worse as the day went on.


The more damning evidence against a QE "Hope" driven rally from the ECB is gold itself or GLD which has the most to gain from easing measures.


This is the SPY in green vs GLD in red on a $100 scale, meaning if you invested $100 in each at the start of the chart which is almost exactly today only, the scale on the right in your return and don't forget the 3C/GLD post.


What I find also very interesting are the 3C charts in the context of what this move was about. Remember before the slightest hint of a move down started, I put out trend expectations and the first was a strong pullback that would take us easily below the bear flag (which happened on the second day of the pullback), but I was also careful to warn, "There's a lot of volatility and there will be noise days in the trend", Tuesday I gave 3 targets of where the first noise move would end up, you saw the charts earlier...


The last target which is above the last reaction high was put there as explained because 4 out of 5 times we see a head fake move "BEFORE" a reversal of any magnitude and this happens on all timeframes. You may recall earlier in the week I described that last rally where the upper target is as having "fallen short" of the upper trendline and as such is a sign to Technical Traders that the flag is weak and about to break. The flag did break, so some shorts were caught with their pants down in another bear trap, the move above that point today would be exactly the kind of move that would make a bear switch their position over to the long side, setting up a bull trap. If you recall, this was the reason that target was included.


I have some interesting charts to look at so don't be surprised if I put out some weekend posts, everyone enjoy your weekend!


The Rumor Scandal...

We all know there are rumors and sometimes they seem to come from the Central Banks through intermediaries like the WSJ, but Draghi himself? It doesn't seem likely, but it does seem likely someone up high knew he'd be talking about some of these things. What is incredible is that some at the ECB where left in the dark.

From the WSJ: Many ECB Members Surprised By Draghi's Comments Suggesting New Bond Buys, Source Tells WSJ


Germany seemed surprised and those two are like two peas in a pod. This is by far one of the stranger rumor days, not just because of the content, the extent (this is the 3rd day now of ECB rumors-it makes sense Draghi is trying to jawbone Spanish Yields lower as one region after another is looking for a bailout), but really strange is that many of these are coming directly from Draghi with other ECB members and the closest ally to the ECB (some might even say puppet master), Germany, in the dark to some extent.


So the question is how much does smart money believe? Today is tough with it being a Friday actual Human traders are scarce as they take their 3 day weekends or leave early on Friday as is common, making it worse is the HFTs were so active today, much of what we see is just machines pushing prices to levels that will trigger floods of volume, they have little to do with real information regarding accumulation/distribution and where money is really going.


We'll take a look at GLD any way, there are a few interesting things...
 From a  1 min accumulation zone to the move up, a relative negative divergence warning that there's selling in to higher prices and the rumors culminating today. It seems GLD should be headed higher on such rumors yet it doesn't move much, half a percent and most of that on the open. The signals show a leading negative divergence, I have to assume HFT activity is represented here as well, so when the rumors that should drive GLD higher pop out, there's a leading divergence suggesting strong selling in to any demand and price barely reacts suggesting the same as does volume at the rumor times.

 Here's one of the un-sourced rumors, 3C makes a new low as GLD rallies a bit on the rumor until it is dismissed by the ECB.

 Again, during the biggest rumor day the short term chart is leading negative.

 Even the 5 min chart is leading negative, it seems as GLD moved higher the divergence got worse (going leading negative).

The funny thing is, I kind of suspected this move, but I just didn't see the positive divergences that justified going long GLD. The 60 min chart, as long as it is (and important), has given some very good and very sharp/fast signals. The first long signal to the left in white developed in 2 days and that was the largest 1-day move up in GLD since 2009, it was sold in to and the signals ther were clear. The pops between 6/29 and 7/5 had no 3C support and failed, then a positive divergence, but in the falt area before the most recent run, no positive divergence and no support from 3C.


It seems that these most recent rumors either were not taking seriously or even if they were genuine, there's too many conflicting agendas in the EU to get anything done or they realize any such action is still a long way off and it's more important to bring GLD back down to a price range in which it makes sense to accumulate it again (remember the longer term prospects are looking like GLD is building a base for a longer term bullish move-also a ways off).


It would seem that equities are still running on hope as GLD was not too excited about this latest round of hope induced news, however we can't forget the majority of the market today was likely run by machines tasked with one thing, hit stops. 


CONTEXT Worsens

From our member who provides excellent sentiment reports, today he sent me a High Frequency Trading Alert, basically confirming the reason I had the final target from Tuesday's post earlier this week above the SPY $138.18 area, the HFT's were busy today going after stops (a lot of traders still put stops in with brokers and those are easily seen by HFTs, so the very same reason I put that target where I did seems to be confirmed by an HFT activity source he follows-bottom line, stops taken out on a bunch of rumors which get even more ridiculous as the day goes on.

In the mean time, all of the assets that usually rally with ES are going the opposite direction, now hitting new lows.

CONTEXT's histogram making new lows as the model diverges from ES...

The reason I had the target where I did was because in addition to taking out stops, as I said last night, 4 of 5 major reversals start with a head fake move, today would be considered a textbook head fake move.


BIDU Update

I cleared out of BIDU long positions expecting a pullback, however initially as the BIDU trade was setting up, my original expectations were for BIDU to make a counter trend move up that "could" be larger than what we already have. BIDU was entered once as a short and is still at a 15% profit as a core short on a bull trap, this latest move was a bear trap. The question in trade over the coming days will be whether BIDU actually does have more counter trend upside or whether the primary trend is about to re-assert itself (or some other variation).

The charts... (and what a great example of using market manipulation to your favor-both trades successful and both on head fake moves)

 We stalked BIDU, even before it broke out in the yellow box, we knew that was the highest probability and that is also where we wanted to short BIDU-YES IN TO  A BREAKOUT! Since then, BIDU has headed down in what I believe is a primary bear trend, however when we saw this bearish triangle setting up just as it should according to Technical Analysis, we saw something positive in 3C and knew this was a bear trap and BIDU became a short term long trade, even though I kept the core short (hedged with longs), this trade was worth it. Traders expected BIDU to follow the red arrows to a new trend lower, instead it sucked them in on a positive divergence on a break lower and then broke higher causing them to cover and sending BIDU higher. I still think there's a good chance BIDU could continue higher, but I do think it will pullback before it goes much higher and how it act in that pullback will tell us a lot about the future of any further upside gains.

 As for the long term trend (the core short position), look at the daily chart of BIDU from late 2008 where it was heavily accumulated and then sold in small pieces in to strength, the 2011 top was bad with a leading neg. divergence, the 2012 top even worse as 3C is now lower than it was when BIDU was trading at $10 in 2009.

 The 4 hour chart showing the neg. divergence and where we shorted BIDU (in yellow), but also a recent positive where the bearish price pattern was, a bear trap.

 Recently the 1 min chart has gone deeply negative

 And the 2 min

 The 3 min shows the last accumulation area as BIDU squeezed shorts and that is now going negative

 The 5 min chart showing the same, also pretty negative.

It looks like the highest near term probabilities are a move to the downside, how BIDU and 3C react during such a move will tell us more about the near future.


The 15 min chart shows the bearish price area forming, the break below and the accumulation of all those short and the confirmation of the move higher, we'll have to see how this chart reacts as well.


Filling Out FAZ Equity Long

This is not an options trade, but rather a long in the equites only model portfolio, I may be a bit early, I may be right on time, but I'm going to go ahead and fill out the FAZ position in the longer term portfolio.

I'll be the first to admit this slight break of support is not much of a typical head fake move, but technician's almost always use the exact support resistance level. It's a little bit of a gamble, but this isn't using options and I have always been much more patient when it's a straight equity trade rather than an options trade.


 The 1 min was progressing along nicely and then jumped to a leading local high.

 The 2 min chart's trend overall is in line with the trend expectation.


 The 5 min chart has a nice long positive relative divergence, in fact its actually leading, I drew it in as relative just because I was marking a relative position from earlier in the week.

And the hourly is why I have more patience with this, this is an overall leading positive divergence on a long chart in a big area.

Intraday TICK Chart


Dislocation

 The loss of today's entire gain or 120 PIPS IN 45 MINUTES!

The SPY in green vs the Euro in red, note where they are in relation to the open.

Update

The Euro is taking the ECB rebuttal of an un-sourced rumor worse than the market at this point, remember the Euro and the market have a pretty tight correlation and any move higher in the dollar hurts the market.

Based on the 3C charts of the Euro last night, I said my gut feeling was we gap higher today, I also said the only question was "when will the move be faded?", early or later in the day? It seems it is being faded or set up for that right now as the currencies that support the market are not helping out.

 The 1, 2 and this 3 min chart (that's pretty fast migration of a negative divergence) are all leading negative on the ECB's comments that the "Rumor" was actually nothing more than run of the mill-PEOPLE-THINK ABOUT WHERE THE SPY IS, WHAT ORDERS WOULD BE TRIGGERED, THE TIMING OF THESE NON-SENSICAL RUMORS! Do you really think this is all just coincidence?

The proxy for the $USD intraday was already in a positive position, it is even more positive in a leading position after the ECB comment.

UVXY Call Position Opened

I chose to split the 1/2 size Options model portfolio position like this, of the 50%, 20% went to September $7 Calls and 30% went to August $7 Calls. I may be getting a little too fancy for my britches there, but I wanted a longer dated position in case I decide I want to sit through a correction.

I'll look to add the rest either on a signal I just can't pass up or after the weekend passes and the rumors are dealt with (of course the rumors could also be along the lines of this morning's German Central Bank shooting down Draghi's comments)-two sides of the coin.

Going to Open 1/2 UVXY Call position

I'll probably look at August $7.00, but I'm only opening half as there's plenty of time over the weekend to put out more unsourced rumors, but with the 1-15 min various market charts in the position they are in and a parabolic spike, I think 1/2 a position is not too crazy.

Follow up

From today's post regarding targets for the SPY published here on Tuesday,

More Rumors and we hit Target 2-GLD may not be agreeing


The following chart and commentary are from the post linked above....

"The 3 SPY targets posted Tuesday of this week, we are at the second, the 3rd would be a break above recent highs which would not be all that unusual as head fake moves are seen about 4/5 times before a major reversal, that's why that specific target was added."

And now our current daily chart...

All 3 targets posted on Tuesday for the SPY have been hit, make sure to check out the bold from the chart and post above.

The $140 area would be a real solid head fake move, but I don't get the feeling we are headed there, especially as the news that the last would be rumor to take out all stops was just shot down by the ECB itself-the stops are still taken out.

Another Rumor Just broke

When you see this, you can almost be sure there's some news, in this case an unsourced rumor...

That's all this market is running on now, rumors.

The rumor:

From Bloomberg


  • DRAGHI SAID TO SPEAK TO WEIDMANN BEFORE AUG. 2 COUNCIL MEETING
  • DRAGHI SAID TO FAVOR GIVING ESM BANKING LICENSE IN LONGER TERM
  • DRAGHI'S PROPOSAL SAID TO INCLUDE BOND BUYS, RATE CUT, NEW LTRO

Now the denial... This is why we don't chase


An ECB spokeswoman said in an e-mailed statement that it is usual practice and nothing special that Draghi meets or talks with the members of the Governing Council. She declined to comment on the content of any talks.

FB Update

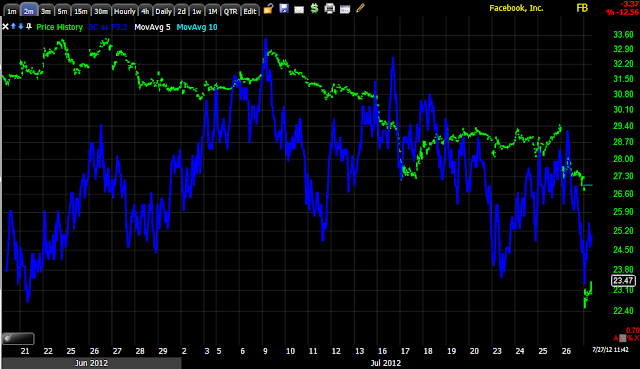
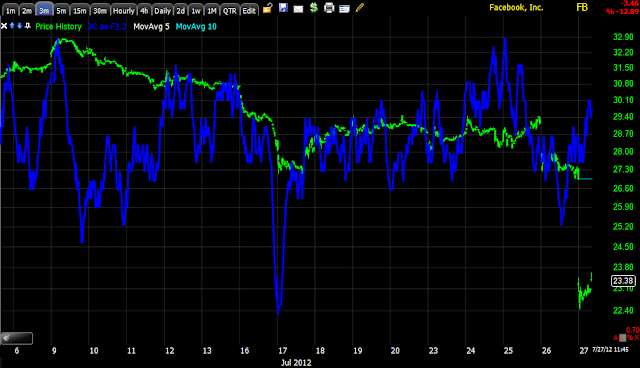
The 1, 2, 3, and 5 min charts are turning to a negative intraday divergence in FB and some other stocks and averages as well. The 15  min and up haven't changed. Perhaps FB will do some base building in the area? It's too early to say, but I just wanted short term traders to know about those divergences.

SLV-WOW

Any one who knows me knows if there's one asset class I hate to analyze, it's SLV because it gets so manipulated.

I just looked at it for a member and saw something interesting, remember how I mentioned GLD looks like it is setting up a longer term bullish trend, SLV seems to have joined it.

Follow me here, first we seem to be just looking at a head fake move the last 2 days.

 Here we have the typical bear flag, last night I got a sentiment update and the blogs and Twitter stream are strewn with the bodies of bears who went short on BEARISH PRICE PATTERNS THAT ENDED UP BEING BEAR TRAPS. How many times in the last month have I said, "This looks like a bear trap"? In any case, here's a bear flag, a consolidation/continuation pattern which comes after a downtrend in price and is expected to follow the path of the red arrows (the true technical name for this pattern is a "bear pennant"). Instead there was a head fake move to the upside, but guess what, even that was a head fake and the longs got taken out too. Here's the important part, Technical analysis teaches that if a important price pattern fails, you should reverse your trade in the opposite direction. That means the shorts that entered during the formation of the bear pennant not only got stopped out on the move up, but then went long and were stopped out on that trade too, this is what I call a "Crazy Ivan Shakeout" or at least a version of it. The next important part is after all of this happened, SLV seems to have formed a base in white.


 Here's a closer look at what "appears" to be a base in SLV, although unlike GLD (to a degree), this base seems more along the lines of a sub-intermediate uptrend or maybe an intermediate trend, gold looks more like it may be forming a Primary uptrend or bull market. In any case, here in yellow, every time my trend line was violated price fell. I would expect that if this were an actual base, we'd see a strong shakeout move below the range before a move up.


 Now for what seems like short term trade along the lines of prices above the trendline on the chart above, we have a 1 min negative divergence like many others in the recent past as price is above the resistance trendline of what appears to be a base area, but this negative divergence is worse than former ones. Perhaps SLV is going to make a move down that is along the lines of the pullback trend/move down we expect in the market, perhaps even (as I suspect that move may be very sharp in the market), it may even make the head fake move I mentioned above below the range before an upside reversal. If it were to do that, it would put SLV in the same trend category expectations we have for the market, after the pullback, a return to the sub-intermediate trend higher that could be VERY sharp and lead to a short squeeze. This is getting very interesting.


 The 2 min chart looks like SLV is making a small head fake move above the resistance trendline and seeing a negative divergence here.

 The same on the 3 min chart, but again, the divergence now is bigger than past ones.

 The 5 min chart is our first real glimpse of what appears to be accumulation and then distribution when prices get too high, they move lower and are accumulated again, but again we have a stronger than usual negative divergence now.

 The 15 min chart goes on to show us what looks like SLV being worked by professionals to accumulate at a specific price for a large institutional investor or many of them.


 The 15 min chart close up shows the larger than normal positive divergence at the extreme lows of SLV and a negative divergence above the upper trendline defined in the second chart of this post.

 Just look at SLV since the pennant formation of the bear flag/pennant and the overall trend, that seems to tell us something bigger is going on and it falls in line to some degree with the sub-intermediate uptrend expected to follow in the market after the pullback move is over. Note even the head fake move out of the pennant saw a negative divergence and no strong distribution in the pennant as technical traders assumed there would be. 60 min.


 The trend of the 4 hour chart.

And the overall trend of the daily from uptrend confirmation to a negative divergence to downtrend confirmation to a recent positive divergence on a daily chart that is also leading, which is big for a daily chart.

INTERESTING!!!!

WOW

That's quite a move in FB while I was putting together that FB post.

FB Update

The big one! The good thing about simple option buying (calls or puts) is that you can define your maximum risk, the bad thing is that if your not careful in position sizing, your maximum risk can be realized in a day. I haven't found a great system yet for managing risk on options trades, although I know there are some great tools out there. I just tend to go kind of old school and simple and treat options trades as "My risk is maximum risk" on every trade, so the FB position right now (even with a couple of entries at 90+% losses) still only represents about a 5% portfolio loss, which is about 3% bigger than I'd normally like for 1 position, but it's a work in progress.

As for FB Calls, I have Aug 27 and 28 and I see no point in selling them now. There are a few interesting things about the FB chart, but as I warned when we first looked at FB as a long and many of us made a LOT of money on FB when ALL is said and done, the main problem was FB's limited trading history, that was the risk when we first went long at the bottom, that's the same risk on some of the signals now; it worked out fine when we first went long at the bottom, maybe in fact it works out fine again, but that is the risk. Now for the charts, which are also difficult to display as the price scale was just changed and the limited history in FB also makes scaling difficult.

(Also don't forget the RIMM trade that was before earnings, we went long on positive divergences, after earnings RIMM fell about 9% and we held based on positive signals still, a few weeks later they had a major management shake up and the trade turned in to a nice profit, the positive divergences were there for a reason, just not the one we assumed)

 The 1 min chart, speaks for itself I think

 Here's where it becomes difficult to show a 2 min chart correctly because of maximum bars allowed in the software and the actual 3C trend, you'll understand better in a moment.

 For now we'll use the intraday 2 min chart which has been going positive most of the morning.

 Here's the 3 min chart displayed with the same problems as the 1 min chart, but because the 3 min chart is a longer timeframe it has more history, now lets zoom this out to full zoom and check the trend (something we can't do with the 2 min chart).


 This shows the selling in to strength and the reason I wanted to wait on FB and look for positive divergences before adding too much, the 3 min chart seems to show us a pretty positive trend despite today's gap down.

 Now that you understand the scaling issues, I'll just show you what was important on the 5 min chart, the negative divergence, which by the way is not all that negative, but enough for me to want to wait for a more positive set up before entering FB again after a successful initial trade-also the reason I didn't really like the idea of holding FB without positive signals, well today we have some positive signals, in fact a bit longer than just today.

 The 15 min chart shows a pretty long relative negative divergence, but not a sharp leading negative divergence, which makes me question as I did weeks ago, "Just how strong is the actual distribution that took place?" We also have a 15 min positive divergence, interesting.

 A 30 min as well

Now, this is the 60 min chart and I show it to you this way so you can really see the scale of things, that white box at the time, was a HUGE leading positive divergence, REALLY big, that's the reason we got long the world's most hated stock and made good money doing it. So now we have price below that level, but 3C as of now (and maybe it takes some time, but I'd think it would have happened by now if it was going to), is still up quite a bit higher forming what can only be called a leading positive divergence. So yes, I'm holding the FB position, maybe I'd even consider adding, but that would be on the merit of new signals as a new trade.