Wednesday, March 2, 2011

CFW Trade from yesterday

Here's the idea from yesterday and today the trade is up nearly 43%. If you are in CFW, be sure to contact me-this is not buy and hold, it's a market gift.

YESTERDAY'S BQI Trade is up double digits!

Keep an eye on this one, if you're in it, let me know as well as our trade today in DEJ which is either at double digits or close depending on your entry, these are not buy and hold, they run with the bounce for the most part. I've updated many trades and will continue to do so. I have to do a lot of back tracking, but if you are in a trade that is not updated and on the list, let me know and I can give you the most current information on it.

The March list should appear with the other two shortly.

Keep an eye on USO

It's nearly there for anyone wanting to establish a position....

TICK Chart

Obviously as you'd expect, the TICK chart looks better today, but yesterdays damage hasn't been seen in probably months, it's important if this market bounces to remember what a bounce is and what a trend is and the inherent instability in the market on any downside event.

Translation: Keep your eye on the forrest, right now the trees are good for set ups.

Trade Alert-BPZ Long

Here's an idea from a member I just looked at ( we also traded this one early last month), very nice looking probabilities in BPZ long.

 30 min chart consolidation-volume is right and it's a stock that would probably slip by the black boxes.


3C looks to be strong in the consolidation, this one is pennies from a breakout above $6.50

SPY-USO Update

 SPY 5 min in a leading positive divergence suggests we have more upside here.

 Plausible targets? I'd say the base of the descending wedge would be an obvious one, it may also create another false breakout/volatility, the white box is the area, although we'll have to continue to monitor 3C for signs of distribution.

USO
 a 5-day chart shows the significance of the USO move which has been pretty predictable thus far. The resistance zone from q1-2010 is the next area we'll be watching.

 On the hourly we see a good divergence here that should be able to hold USO's uptrend for awhile longer as the accumulative cycle is rather large, meaning there's a lot of shares to distribute and we aren't seeing that process underway as of yet.

On the 1 min, there's a bit of a negative divergence, but most indicators get turned around in the volatility of a consolidation such as this bullish ascending triangle, I wouldn't be too worried about it and just watch for the next breakout above the 2 p.m.-ish highs today.

Trade Alert, PDC (long) Just triggered an alert for a long trade on a breakout.

GLD Teetering

Remember this morning's warning with respect to GLD that this may very well be a shortable false breakout, well we are getting very close to testing that.


I'd wait for confirmation before doing too much, but it's time to start paying closer attention.


I'm thinking we'll see a bounce off support or in the area, what happens next is the biggie.

Trade Ideas

I've been scanning and here's what I have for you long and short, they'll hopefully be on the list tonight. Some are in position, some in position you can wait for a bounce if you like (email me for any questions or specifics) and some are close to trades. CLICK ON CHARTS FOR LARGER VIEW!!!

BYD
 The red trendline is the entry so you could if you like, go short here or wait for a possible bounce.
 The red trendline is the stop on the trend channel.

CQB
 Here the white trend line is the stop on the TC, and the red line is the short entry, so again this is a short now or on a bounce as long as it doesn't close above the white stop trend line.

 Here's the 15 min chart showing distribution into a false upside breakout, I prefer to wait for these false moves before entering a trade, it makes the volatility easier to deal with and the trades tend to be more successful/less stressful

FAZ-This one has been mentioned recently.

 The above charts were short sales, this is a long buy on an inverse ETF which is short exposure to financials. My stop would be at the red trendline and a long position above the white trendline so this one is very close, there may be a pullback though so you may want to phase into the trade. I always prefer to phase into trades when they allow. ADX has shown a change in trend, that would be the downtrend.

 FAZ's Daily 3C chart looks great, this is the most important timeframe and shows the depth of the conviction of institutional buyers. Also note the recent volume.
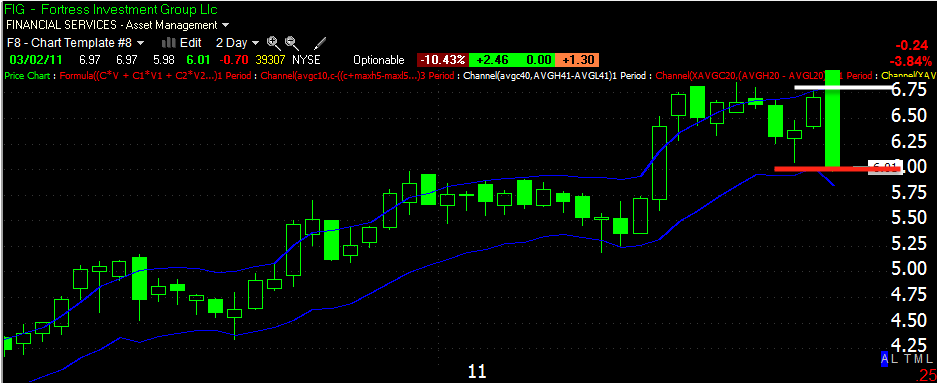
FIG (short)
 Here we have a trend channel near break ending the uptrend, the white line is the stop, the red line is the limit order, so below $6 is where I like this trade with an initial stop of $6.75

 The hourly chart shows what also appears to be a nice false move just yesterday-again, note the volume.

LZB (long)
 LZB looks like it's ready to put in a second leg, this is a tight trade, the stop is at the red trend line, the limit entry is above the white trend line. This is more of a swing trade.

 LZB recent 5 min chart showing a positive divergence.

RCL (short)
 Here again we have a break of the trend channel which has been fairly clean. This could be shorted here I believe or on a bounce, the red line shows where it became a short and the white line is the initial stop.

 RCL's daily 3C chart shows the negative divergence/distribution and the volume is pretty ugly lately.

SFY (Short)
 Here's another recent break and current short position under the red line, the white is the stop for the short. Note ADX also showed a signal of the uptrend ending.

 60 min 3C, TSV, MoneyStream all look horrible and show the negative divergence at the recent highs. The volume is also quite extreme.

TYP (Long)
 ADX again suggesting the downtrend is ended, the trend channel has this as a long at the white trendline with a stop at the red.

Here's the daily positive divergence, very nice and it appears this has been under accumulation for several months suggesting the market is about to change to a downtrend and this should be able to support a nice uptrend.

I'M TRYING TO UPDATE TRADES,

Hopefully i'll have all the recent ideas on the list tonight, this morning's DEJ for anyone who took it should be up between 8-11% already.

There will be a new trade list for March, the speculative list for February as well as the regular Feb. list will remain. I need an assistant, any volunteers :) ??

SPY Update

 the 1 min looks like we are seeing some of that accumulation I was wondering about, it may be for later today, but it's on the 5 min too so we may see another day of upside.

 Here's the 5 min 3C positive divergence I just mentioned.

This will be the trouble for the SPY, The financials haven't reacted well today and are on the edge of the cliff. The "Rising tide lifts all boats" effect may save XLF here, but if not, then expect the SPy to underperform the other averages.

Our Wolf in the Mortgage Industry Just sent this to me-Trade Alert

HSBC suspends all foreclosures- 4 letters: M-E-R-S

I like this as a possible short for several reasons, one is it's a European bank and I feel that the rescue mechanism in the eurozone is in big trouble with Merkel's party's recent shocking defeat in Hamburg elections, sending a clear message, "We are tired of bailing out the rest of Europe".


 This is a 2 day chart because foreign charts tend to be very "gappy", but look at the volume on the breakdown! Right now we are close to some gap support at the red trendline.


 The hourly 3C chart showed big distribution into the highs made late last month-leaks? Probably.

As for a trade, the trend channel is set to 5-days, that's what holds the trend in HSBC or HBC rather. So a stop around the $57.50 area or so and I'd prefer a limit order (not on the books-mental only) under the red trendline under $53 which is a technical break of the trend using my trend channel. I think it's a decent looking short trade, it'll probably bounce off support, but the stop should be wide enough to handle volatility. You could always phase into the trade on a bounce and the limit break to get a better average position.

GLD Update

Remember, I'm not a gold bug, I'm not against gold, I'm just showing you what's happening with GLD within the context of the market and how the market typically reacts. I've tried before to argue against what I've seen based on the fundamentals and the charts usually won.


 GLD 5 day chart with an RSI negative divergence and a lateral toppy looking formation recently.

 1-day char, again RSI negative divergence on yesterday's break out. Today's candle is extremely weak and showing no upside momentum, which opens the door to a reversal.


 3C 5 min of the breakout from the top. We know obvious resistance is usually obviously run by the market as technicians take the top looking pattern to be a failure and go long, the market loves to set up bull traps like this-we see it nearly every day, so we must consider this breakout as a potential bull trap/false breakout.  There's a nasty 5 in negative divergence which suggests heavy profit taking or even distribution, it's not the breakout follow through we' expect to see.

On a 1 min chart, we see the lateral price movement that occurs during distribution. Any move in GLD below the breakout around $139.50 has the potential of sending a snowball of longs selling into the market, which raises the supply equation and price drops fast. If you see this and are inclined to play GLD short, you can do that or take a look at the leveraged DZZ ETF-especially for those who can't go short and need to buy long to get the short exposure.

Just saying, we know how the market operates, we need to watch this, especially as gold has become such an obvious trade.

POMO Results and more

This is how crooked the Fed is, catch this article. This is how and why the banks are still able to make money-the FED GIVES IT TO THEM RISK FREE! The article will make that clear.

As to today's submitted:accepted ratio, it's a bit higher then the median at 4.1x so the Pd's aren't flush with cash, but what they did make, they made a nice profit on. Some of this money should hit the market, especially if we look to close red by 2:30 p.m. or so.

While we are dipping a bit here, what I'm most interested to see is how the 5-15 min 3C charts will turn out, this will tell us if we are just getting a little oversold relief today or if we can expect a bigger bounce. The downdraft makes me think they may be picking up shares for a bigger bounce-REMEMBER that tops are extremely volatile and unless we get a black swan circa 1929, 1987, etc, then the topping process is legitimate, but dangerous to try to trade around to much, thus my most recent risk management article. The first 10% of a move down from the top is the most dangerous and personally I'd keep my risk small and the trades high probability, I'll back up the truck on the 80% trend in the middle. However, a bounce can set up some great opportunities for the longer term picture-which isn't months or years, but perhaps measured in weeks. We'll see what the locals do on the dip.

USO still strong on Libyan Bombing

Gadhafi has bombed near an oil facility that is in fairly secure rebel territory in Brega. It seems Gadhafi is thinking longer term and wants to perhaps cut off any monetary value the rebels could gain in fighting him if they were to control and make a deal to export oil to Europe, in essence there are at least 6 tribal clans, 4 very important and Gadhafi is seemingly expecting a protracted civil war.

Meanwhile robert Gates warns that the US will have to attack Libya in establishing a no fly zone- Remember Iraq burning in the first gulf war, europe can't afford that. I think what Gates says or hints at is nothing compared to the naval/air force and marine amphibious assets they are putting in place. This is nothing but trouble from start to finish, even after Gadhafi is kicked out of power, the clans will struggle much like the Shiite's/Sunnis/Kurds in Iraq and while we mention Kurds, look for trouble in Turkey soon between turkish forces and Kurd rebels as this conflict moves closer and closer into Eastern europe, a very bad place for flash points.

In the meantime, USO should continue to gain on it's breakout, 3C is backing the move fairly well with only a little bit of a negative on the 1 min which may be profit taking or just nothing. The 5 min is confirming the breakout move.

Should the US/Nato get involved in Libya, watch out for unintended consequences, Al Qaeda got all juiced up from the US using Saudi Arabia as a basing point for the first Iraq war, there are sensitivities there towards Americans killing Arabs and Muslims, even those they they may not particularly care for.

 USO daily breakout of resistance, volume looks to be on the way to a higher high. Thus far, USO has acted exactly as we have thought for the last nearly week. Kudos to you all trading USO. I love to see my members fishing.

 USO intraday move-most likely in response to the bombing.


 The accumulation zone on a 15 min 3C chart

USO 5 min 3c confirmation

By the way, Rep. Meeks just said Chis-ims-is that how you pronounce Chasm? Just wondering, I'm not one to criticize.

This could move markets

Bernanke's Testimony before the House Financial Services committee 

A Good Graphic from the AP

This is the theory of the Fed's actions, however in senate testimony and on numerous occasions, Bernanke has first cited the wealth effect of levitating the stock market-that's pure manipulation. Remember, don't fight the Fed, the market will do that for you, just listen to the message of the market.

Graphic

Here comes the bounce

 In the white box we have an inverse H&S -we may make 1 more dip but we are close to breaking out there.

Here's the charts we were looking at yesterday and the 5 min is now leading positive on 3C so I suspect we'll see that intraday strength soon, maybe even a green close as yesterday's price/volume relationship indicated a 1-day oversold condition. No surprises here, and unless we get some political surprises, I'd say the bounce/correction will take place shortly.

EGPT Trade (short)

I hope someone got in on this one, don't discount the events in Egypt, there has been no regime change (the military is the regime) which will lead to conflict at some point. You don't hear much about it, but protests are ongoing in Egypt and the revolutionary business hasn't even started there yet. Look at Tunisia, the first domino, already radical islamist are filling the power vacuum. So this is one ETF with good mid east exposure and it's a longer term position so risk management wise, I like a wide stop, I like the idea of shorting on strength as it is bound to be short lived.


 It's volatile, but trending down.

The 2-day Trend Channel stop just north of $19-please stay way from whole numbers like $19 for stops, use 19.11 or 18.87, but not $19.

Still Catching Up

I had over 75 emails yesterday so I'm still catching up with a few things, I just can't get up early enough!

In any case, we're light today on US data, the market so far has acted something like 3C was showing yesterday, no big gaps down, so I'm assuming the 1-5 min positive market divergences out of the bottom of yesterday's descending wedge will still stand as of this moment now that the shorts are pulled in on what is perceived as a failed pattern-so watch for some early intraday strength, we'll see where it goes from there.

USO has broken out by a hair (the move is mostly confirmed so far, the 5 min chart is in confirmation), and today being we are light on data, escalating tensions in Libya and other parts of the world will probably be the catalyst for any moves so keep an eye on mainstream press and of course Stratfor if you are a member or sign up for a free article. I expect if this drags on in Libya, there will be some NATO/US air support for the rebels which could have market repercussions-boots on the ground will be a huge escalation.  Watch the Palestinian territories as well, it's starting to heat up there as well as the usuals-Bahrain, Yemen and the gulf emirates.

N. Korea has been quiet too long, that won't go on forever, especially with the redeployment of US Naval assets, that's why the new navy map is so important, if that region is left short handed, N. Korea will likely make a move.

I have a ton of trading ideas I want to eyeball and then I'll start sending those out. I'd be looking at any shorts you like and thinking about using any market strength to "get your toes wet" and the other themes we've discussed as far as leverage on longs and longs in general.

Be back soon with another update, I really want to check these trades before sending them out.

Don't forget to check out the featured trade, LVS as well.

Trade Alert DEJ (Long) just triggered