Tuesday, September 30, 2014

Daily Wrap

So much for any hopes of ramping the market to the best possible close for the quarter as late day action  was anything but impressive with HYG initially appearing to try to ramp the market even though we saw distribution through the 1, 2 and 3 min timeframes today (3 min is the longest timeframe its positive divegrence hit), obviously it was an unsuccessful attempt...
 HYG (blue) vs SPX intraday ramped just before 2 p.m. and to no effect.

russell 
The major averages closed between the NDX's +0.06% and the Russell 2000's -1.45%.

For the quarter the R2K saw a loss of -7.95 and a loss of -5.2% on the year . The SPX saw a modest gain of +0.50% on the quarter, the worst quarterly SPX performance since Q4 2012 , the Dow +1.2% on the quarter and the NDX +4.7% on the quarter, an obvious huge divergence between the R2K and the NDX with the SPX and Dow somewhere in the middle close to unchanged.

As a reminder, this is the 15 min chart for all of 2014 and then some of HYG vs the SPX (green).

Treasuries 
The spread (as of yesterday's close) between the 30 year and 10 year is 69 bps, the lowest since the 2009 lows of March 6th which means the yield curve is at its flattest since the worst of the worst for the market.

The yield curve typically looks something like this...
 The shorter maturities like notes, 2, 5, year have a lower yield while the longer maturities like 10 and 30 pay higher yields. However the inversion or flattening of the yield curve is indicative of economic troubles ahead, inversion is a predictor of economic recession. We already know the spread between the 10 and 30 is at the flattest since the 2-009 market lows on MArch 6th, meanwhile for the quarter, the short end at 5 years dramatically underperformed sending 5 year yields higher, again, a flattening like behavior.

5 year yields (green) vs. 10 and 30 (white and blue respectively) for the quarter. There's approx. 30 basis points of flattening for the quarter between the 5 year yield and 30 year.

Not a great bit of news from the treasury complex.

Breadth for the quarter doesn't even need to be addressed, just look at any of the breadth posts and you'll see it dramatically declined starting July 1st, the end of Q2.

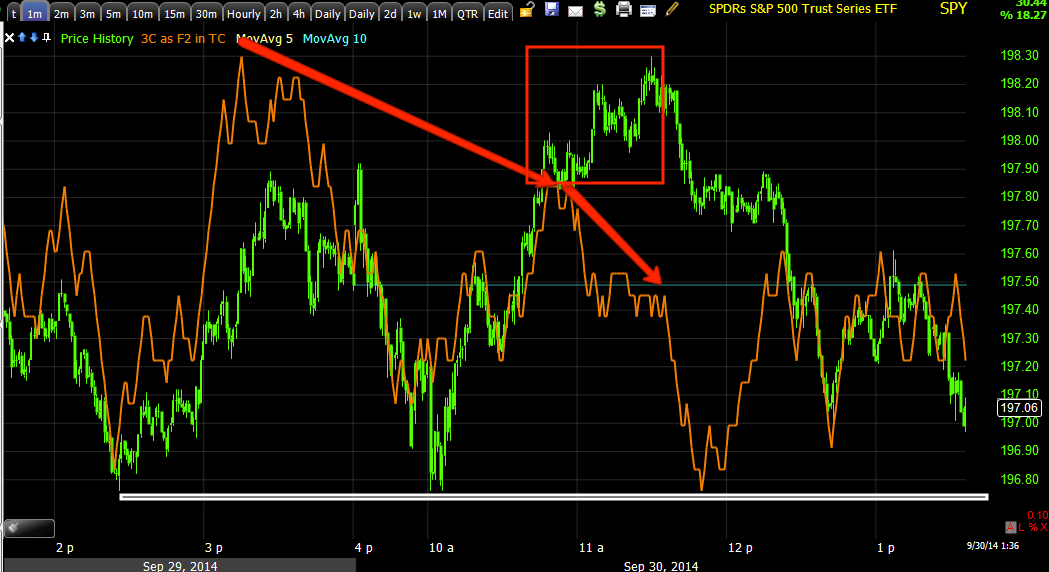
On the day, leading indicators had some interesting take-aways, for example, Professional sentiment was up on the day,  which fits with Friday's Week Ahead forecast of a post Q3/Window Dressing bounce as small and mid-caps have been hammered hard, they may be looking interesting as an oversold corrective move, at least that was the thinking Friday as we'd likely have to wait for the quarter and window dressing to end today.
 Our first indicator has been range bound with the market, but up on the day today.

Our second a little different, but accurate and up on the day today.

It's important however to take in the full picture and the very same indicator on a 30 min chart vs the SPX looks like this...

30 min pro sentiment, not far off HYG, 3C charts in the space and certainly breadth.

Also similar to our newer leading indicator, SPX/RUT Ratio, especially at the August cycle head fake highs.

 The indicator, like HYG and many others, led the market to stage 4 decline lows, especially the RUT.

Interestingly as this indicator has been 100% accurate so far, the positive signal it put in at the white trendline allowed the market to hold its ground in to the end of the quarter, but over the day a new leading low, not confirming where SPX price is, developed.  However it is much closer to the IWM and confirming its new low for the cycle.

Indicator (red) vs RUT (green)...

3C charts

In my view, unless the 3C charts were positive just to hold a consolidation pattern, which is usually only a short term e vent on a very short timeframe, I'd say the amount of selling underperforming assets with probably something near 50% of the NASDAQ Composite and 50% of the Russell 2000 stocks in a technical bear market, there certainly wouldn't be much accumulation during window dressing,  this is the reason in the Week Ahead post I suspected if we saw anything it would be post window dressing, Wednesday. I think there's enough room to work with to put in that post Window dressing bounce as a lot of small and mid caps are oversold or viewed as such as they were the worst performers on the quarter and thus sold the heaviest this past week or so. I do think we'll have a clear signal and be able to make a choice of whether to participate or not, at this point I would not because of the small size of any base, but again, I wouldn't expect any kind of accumulation that can move the market while net selling during window dressing is underway.

So window dressing is over, guess what also ends this month? POMO, QE ends Oct. 28th as the F_E_D released the last POMO schedule, after that, all of the retail crowd who believes the F_E_D has their back, will be on their own.

As for Dominant Price Volume Relationships    today, only the Russell and the SPX had one, it was Close Down/Volume Up which is typically a 1-day oversold event with the market closing green the next day, the Dow and NASDAQ had no dominant relationships.

S&P Sectors  Only 3 of 9 sectors closed green today with Tech leading at +.30% and Energy lagging at -1.25%.  The 5 day performance has 8 of 0 red, the 10-day has 9 of 9 red and the 21 day (close to a trading month) has 8 of 9 sectors red, there's certainly a notable change in character there as well.

Morningstar Industry/Sub-Industry Groups  Only 42 of 238 were green today, not as bad as we have seen over the past few weeks, but pretty bad.

On a near term basis, breadth from a S&P and Morningstar Sector perspective is oversold and would be due for a normal corrective bounce.

While breadth did deteriorate today, especially among the Advance / Decline lines, the glaring red flag in breadth indicators is in place already for example, the NASDAQ Composite's Advance / Decline Line...
 NASDAQ Composite A/D line green vs NASDAQ Composite...

 "The Percentage of NYSE 1 Standard Deviation ABOVE their 200-day Moving Average" vs the SPX. These are considered healthy stocks, they have fallen way off to just about 2014 lows.

However we don't even have to look at momentum stocks , just the standard 40 and 200 day moving average and it's clear that this market is not long for the world.

 The Percentage of NYSE stocks ABOVE their 40-day Moving Average (green) vs the SPX

The Percentage of NYSE stocks ABOVE their 200-day Moving Average

Houston, we have a problem....

And on that note, I'll see you in the morning. Have a great evening...


Final Window Dressing Is In- Toxic Financials...

I was very eagerly awaiting this information today. Some of you may recall the F_E_D's newer RRP (Reverse Repo Facility) that banks have been using the VERY last day of either the month or more often, the quarter to make their financial condition appear healthier than it is by renting treasuries (high quality collateral) from the F_E_D for a SINGLE DAY, which is the last day of the quarter clearly for Window Dressing to fool investors in to thinking the banks are healthier than they are and to "fool" their regulators who happen to be the same people lending them these assets in the first place.

When the F_E_D first introduced the RRP facility it was under the auspices of helping as a policy tool when it comes time to hike interest rates, but it has been shown to be ANYTHING BUT.

Back in January before we really caught on to what was going on with the new facility, the usage was $140 bn dollars. We really noted the use of the F_E_D's RRP program , supposedly a tool for hiking rates when the time comes , at the end of April this year when it set the second highest usage ever on the last day of April , month end window dressing.

From there, it became evident that the banks are not in the financial condition they portray by borrowing collateral from the F_E_D for a single day, and the highest usage is always at quarter's end, specifically the very last day of the quarter.

So we started paying more attention and found that Q2's June 30th, saw the usage of the RRP facility go up to a new record usage of $340 billion dollars spread among 97 institutions, 1/3 of a trillion in collateral shortfalls and all of this to fool investors and regulators, except regulators are the same ones loaning the bank the assets for a single day.

Naturally with today being the last day of Q3, I was very interested in what would happen with the Reverse Repo facility as this is the last day for quarter end window dressing.


Not long ago the F_E_D CAPPED the usage of the RRP at $300 bn and on September 17th, they announced that on September 30th, unlike all other days they conduct reverse repos between 12:45 and 1:13, Sept. 30th (today) would be conducted at 8 a.m. - 8:30 a.m. EDT, the only thing special about today vs any other day they conduct the operation is today is the last day of the quarter with a facility that clearly was never meant to be an interest rate hiking tool, but a bank window dressing tool.

I was expecting the entire $300 bn allotment to be taken up as the previous quarter's bank window dressing set a new record, to many people's shock and disbelief, the usage of the Reverse Repurchase Facility today reached a new record high, above and beyond the F_E_D's own $300 bn cap of a stunning $407.167 BILLION dollars, creeping up on half a trillion in collateral shortfalls at the banks. In addition the normal 5 basis points for using the program came in today at a spread of between 5 bps to a negative -20 bps.

Tomorrow the assets will be repurchased by the F_E_D, the banks will have completed window dressing and appear to be in better shape than they are, if only for a day and the regulators will be fooled, who happen to be the F_E_D!

There are a lot of reasons I like FAZ, 3x short Financials, but I think you can safely add this to the list of net negatives for the banking sector.


Interestingly about 2 weeks ago

Q3 Closeout EOD Ramp Attempt...

The only one of the major averages that pulled back intraday and had significant enough positive divergences to try to ramp the close for closing the quarter was the IWM, here are the charts quickly...

 IWM 2 min accumulation in to today's move lower...

 IWM 5 min accumulation in to today's move lower...

This is obviously enough to load up to try to ramp the close,  but is it enough to look at a long swing trade, I go to the Russell 2000 Index Futures...


The 5 min chart has NO positive divergence.

 The 7 min chart has nothing nut distribution sending futures lower.

The 15 min chart is no more than in line on the downside.

The 60 min chart is the same.

I can see no reason to take on long risk here, so we go back to Friday's Week Ahead and look for any possible accumulation tomorrow as the quarter has ended and window dressing with it.

The Custom TICK trying to ramp the close...

As well as NYSE TICK

HYG was even called in with a little bump.

Coming, as I hoped, I have the Window Dressing Data that supports Financial Shorts or a FAZ long position.

Promised SQQQ Analysis

In this post I'm comparing the underlying, QQQ or NASDAQ 100 to the 3x leveraged ETFs, both long (TQQQ) and short (SQQQ), I am personally holding SQQQ along with SRTY (3x short IWM).

I have found over the years, quite often the leveraged ETFs will give signals sooner or stronger than the underlying, which I would assume is a function of the need to move faster because of the 3x leverage.

When I look at SQQQ's chart (I only included 9 as I didn't want this post to go on forever), I can't see a reason not to own it, even right here without a pullback and better entry, the overall position over a period of several months I would think would be lucrative enough that a few percent here or there on the entry would pale in comparison to missing the position, which is why, despite my desire to get some swing trades going "if" the signals make the risk/reward worthwhile, I'd still be loathe to give up what I consider to be a longer term trending position on the overall market that I intend to hold for some time.

*By the way, to the best of my knowledge, regulations just increased 3x leveraged ETF margin maintenance to 85% last week, so someone is expecting volatility ahead at the regulator level which makes sense considering NYSE margin debt and investor net worth (ability to meet margin calls).

Here are the charts, QQQ will be first in each timeframe followed by the 3x long, TQQQ which should look similar to QQQ, although you might notice signals are earlier or sharper and then SQQQ, the 3x short QQQ ETF which should look like the mirror opposite.

 QQQ 2 hour leading negative through stage 3 of the August cycle and the head fake move (yellow)

TQQQ 2 hour, essentially the same, note the strong 3C distribution through the large Stage 3 top and the head fake move.

SQQQ (3x short QQQ) with a strong leading positive divegrence as QQQ was at stage 2 as well as higher leading positive divergences since the head fake move in the broader market.

 QQQ 60 min going negative at stage 3 and worse at the head fake move.

TQQQ 60 min looking even worse.

However SQQQ has an amazing 60 min leading positive divegrence.

When I talk about looking for divergences, although we try to interpret whatever asset we are looking at,  these are the kinds of signals that shouldn't be ignored, these are the ones I call, "Jumping off the chart".

 30 min QQQ sharply leading negative since the market's head fake move.

TQQQ 30 min

And SQQQ 30 min. Even as we have seen some lower prices in SQQQ at certain areas, the divergence has been strong and growing. I believe these are not typical retail and these are strong hand shorts that aren't easily shaken out by new high headlines or strong 1-day moves that spook retail traders.

I can't see any good reason not to have exposure here to SQQQ long on a long term basis, although I like it a lot as a swing trade at the right areas as well, I'd just rather let this work for a year or so and I think we'll be very happy.

THE PROVE IT TO ME TRADE...

I think I've been pretty clear on the "week Ahead" (this week) and so far what we've seen this week, although I'll admit freely the fact we have Window Dressing and the end of the quarter today, does leave some question marks as to what certain signals actually mean when they'd otherwise be pretty clear as there's obviously a higher probability for  more than one motive until today's close.

SRTY has been doing excellent for me so when we saw the stage 3 top for the August cycle and predicted (as is the norm for this situation) a head fake move up with distribution in to it and then the market following HYG to stage 4 decline, it takes a pretty good deal of evidence to step away from a position like SRTY when the trend since the head fake move, typically the last thing we see in stage 3 before a stage 4 decline, looks like this...

 SPY stage 3 top followed by the transitional head fake move, a failed breakout and stage 4 decline with a series of lower highs and lower lows, or a downtrend which is of course the trend expected in stage 4 decline.

The IWM has an even longer trend to the downside, so obviously at this point, anything on the long side has to prove itself.

I started this post before the market started heading down just after 1 p.m. in anticipation of such an event as signals were pointing in that direction so some of these charts are going to be redundant now that we know their signals were correct, but the bigger point is still valid.

In Index Futures...
 The 5 min futures usually need a positive divegrence before I'd consider any long trade, but this may be about more than just a long swing trade, it could be about the entries in certain assets, FSLR is one I'm looking at closely for a fill out position as it has performed well on the partial and really only needs a little bounce for a good entry, AAPL fill-out is another and on and on. The other possibility is the pinning of the market because it may indeed just be that weak that the best close they can get for the quarter is right here and whatever support from 3C this week, has been to just hold the market in place to prevent a lower Q3 close, some evidence in market breadth is suggestive of that possibility, although it would be one of the largest consolidation divergences I have seen, which would make sense considering how bad the market looks on an continuing basis.

Again, there may be more than 1 motivation here or an unusual, unexpected one due to the end of quarter.

I was pointing out with this chart that the SPY is likely to see some lower movement today, it has already done that as I was uploading the charts,  this is what I wanted to see since yesterday because any accumulation to strengthen a divergence (positive) and lead us to a post Q3 corrective bounce, needs a stronger base than what it has now which requires price to come down, so that was the point in this chart's negative divegrence, the white trendline being the rough area of where ES/SPX futures would need to be.


I was pointing out the same in Russell 2000 futures.

  And I was pointing out the same in the NASDAQ 100 Futures 5 min chart, their negative divegrence suggested a move lower to the trendline.

The 3C indicator would need to make higher highs as price makes lower moves toward those trendlines, none have met that lower target as of this moment.

 The 15 min ES/SPX futures chart is just showing there's no positive, there may be a slight negative relative divegrence between points "A" and "B", otherwise distribution signals have been clear and solid forecasting.

 ES/SPX 30 min is in line with the downtrend.

 As is TF/Russell 2000 60 min, but there's the opportunity for a positive divegrence, although there's really not anything special there yet, but it wouldn't take much for the market to prove it to us before price even made a move.


 Again with the QQQ intraday 1 min I was just pointing out the intraday distribution at highs and the probability of lower prices coming shortly.


 On the QQQ 15 min chart I'm pointing out the same right now, but also the opportunity that such a move could  create toward the lower trendline  because the current base which essentially is only the white trendline, is not enough to do much other than hold price in place or maybe a slight bounce.

In other words, as we sit right now,  this divegrence is not a "NEW" opportunity creator, however it could be confirmation for existing shorts if the improvement doesn't show up.

 The SPY intraday is also showing a negative intraday divergence which pointed toward lower prices, which are still being made as I write.

 This is the SPY 15 min chart, it's divegrence area and what would be most useful, the green arrow representing price below or around the trendline (white) while the 3C chart moves like the orange arrow.

The yellow arrow is the new low expected early / Monday of this week.

The Custom TICK failed pretty quick intraday today.

Here's where it gets interesting... HYG has been used as market support, however, things are changing...
 This is an intraday 1 min HYG chart, these flat ranges look boring, but they tend to have the most underlying action, in this case, distribution. Remember HYG's 3 min leading positive divgerence sent it higher as market support or a short term manipulation lever as it has been for months, even years.

 Interestingly, this doesn't look like a fluke as there's migration of the negative divegrence intraday to the 2 min chart.

 While this 3 min HYG chart's 3 min positive is what we have been looking at, on an intraday basis, and this is how all new divergences start ...

The 3 min chart on an intraday basis is seeing the same migration of the divergence, negative, which means it's getting stronger.

Again this makes me question motivations as this is happening in to the last few hours of Q3.

 Our custom SPX/RUT Ratio Indicator has given out, not horribly, but it too was calling for lower intraday prices.

And High Yield Credit...
is not looking good.

The only other two leading indicators of interest at the moment are professional sentiment, are slightly positive in to the decline since 1, however not anything so strong as to be worth a screen capture.

The market is near the area where it CAN prove itself, or it can fail badly,  the timing we predicted for the week ahead was Wednesday, the first of the month so this would be the time to do it or darn close.

I also want to get an SRTY and especially SQQQ chart up, you'll see what I mean about the shorts being strong hands with weak hands shaken out as well as how incredible these two 3x inverse ETFS (IWM and QQQ) really look.