Thursday, August 11, 2011

Closing Stats

Today was another WOW day and the pendulum continues to provide exceptional volatility. It wasn't too long ago that a 1.5% gain was a big move, now we have the last 4 days down 6.66%, up 4.74%, down 4.42% and today up 4.47%-that's extreme volatility.

As far a internals go, all 30 major Morningstar Groups closed green, of the 239 major and sub-industry groups only 1 closed in the red today, "Closed End Debt Funds".

Certainly CSCO was a major Catalyst as well as Initial Claims coming in better then expected, but I think this has more to do with a bottoming process.

Other Internals: The NYSE had a volume ratio of 5:1 up vs down volume. There were 5832 advancing issues and 1027 declining issues. What was most impressive was today's NYSE dominant Price Volume Relationship, it was Close Down Volume Down like all of the other averages, but in a close second was Close Up/Volume Up, the most bullish of the 4 relationships.

The Dow 30 saw all 30 stocks close GREEN!
The NASDAQ 100 saw all 100 stocks close GREEN
The Russell 2k saw 1862 stocks close green and only 94 close down
The S&P 500 only had 3 decliners!

Of my 5% or greater list, 1920 on the close as for -5%, 127 mostly inverse ETFs.

By most measures exceptionally strong internals.

Also noteworthy were the declines in the safe haven trades, Gold declined over 2%, TLT (Treasuries) lost over 5%. The Swiss Franc closed down 4.69%, but part of that was on talk of a Franc/Euro Peg.

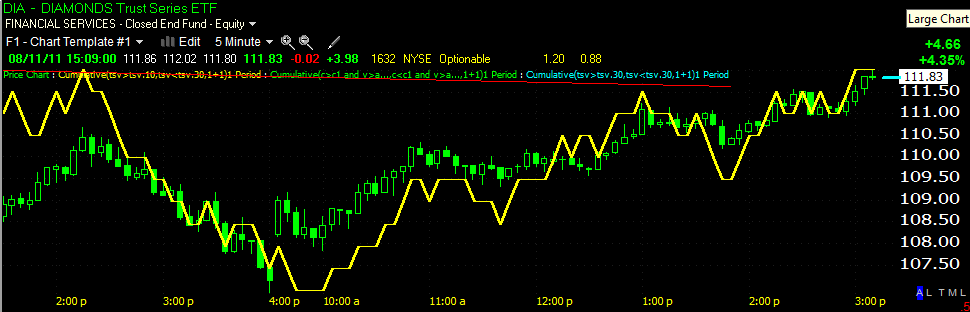
As I expected since the early morning, the inverse H&S seen in all of the major averages broke out and then was gamed in the last 15 minutes to fall below the breakout line. This gives me a gut feeling that we are not done consolidating and Friday wouldn't be the best day to launch a rally, so I'm okay with that, but expect more volatility as  suspect they'll try to lock in short sellers. However, as usual, we'll let 3C and price tell us where this is gong, that's just my gut feeling as I explained late in the day. However I will say the last few day's internals have been very bullish-we just need some volume and that will come when they are ready to kick the market in to stage 2, mark up.

The VIX did close down today, a bullish sign, one more consecutive day down and we would likely see a sharp rally.

I'll be listing quite a few long positions to take a look at buying on a pullback, there are a lot of charts shaping up. I also get a gut feeling that we are in for some market positive news and I feel that when/if we rally as 3C is suggesting, it's not going to be just a bounce but a spectacular move. After that move, I think it'll be the last before the bottom really falls out and makes the last few weeks look like a walk in the park. All of this equals OPPORTUNITY! Just keep your eye on the forest, not the trees. Volatility should remain obnoxiously high so initial stops should be wide, to honor the 2% rule, that means fewer shares, but one a position moves in your favor, stops can be tightened and the position can be added to.

Again, keep your eye on the Forest, not the trees. I see 1100 as important support on the S&P, whether it's tested, who knows, but if it is, I suspect it will be part of the Wall Street gaming and wouldn't jump to bearish conclusions too quickly. Heck, we might even be surprised and just see the market take off from here.

Perhaps above all, use your edge over Wall Street and be patient, I smell incredible opportunities brewing.


EXACTLY AS EXPECTED

Early this morning I pointed out the inverse H&S pattern and said it was too obvious, Wall Street has to game it, although I wasn't sure how, a new low could have been 1 way, but this makes more sense. Technical traders are taught, "If a pattern fails, it fails and you should take the other side of the trade".

We didn't have much time at the close for the pattern to fail with the market already up significantly through the breakout point, but this made the most sense and as expected, even though it didn't look likely, Wall Street managed to game the base.

 Here are the closing harts and the red trendline represents the breakout point, the close below it represents the head fake. DIA

 QQQ

SPY

However, Technical Traders only see price and lagging indicators based on price, 3C is not such an indicator and remans stubbornly bullish and positive. Therefore I believe this is as we always see, the head fake before a significant move. I expect some wild volatility tomorrow, but ultimately the path of least resistance according to 3C remains up and all is falling in to place as we have seen so many times before.

Trade Idea SOL (long)

This is a mover, but with a decent pullback, it looks like a high probability trade with reasonable risk.
 A nice 23% gain today

My crossover system giving a long signal. If SOL can pullback to the $3.60 area, a stop can be put in around $3.40 with about 3% risk, that's a decent R:R trade.

LDK long trade follow up

Earlier today I said I'd take profits in LDK and look for another long entry on a pullback.

This $6.00 area is where I'd like to consider a long trade and re-evaluate the entry. If you exited at my post, you missed out on  1.6% of further gain, had you sold at the exact top, but you still made 6+% in less then a day.

Trade Idea RIMM (long)

 Ultimately this is a short term trade idea, RIMM is a ways away from being competitive in handsets. I visualize this trade as breaking above the trading range and the 50 sma, at that point, I'd start looking for a short entry, but the ride should be worth close to 10 points.

Notice this is the first confirmed crossover on my screen. I'd like to enter the trade on a pullback, which I think we will get, to the $23 area, risk is lower there as well with a stop just below $22

Trade Idea VT (long)

This is a dead cat bounce trade, but still these trades can really move.
 The daily chart with likely short term capitulation

My Crossover screen giving a buy signal, I would prefer to buy this one on a pullback to the $43 area.

Trade Idea CBOE (long)

 I like the daily chart price action

My Crossover screen with all 3 conditions met, I would consider a trade here on a pullback to the area in the red box.

KGC Rocking

Take a look at our KGC long trade today
Up 12.22% today! I would consider this a buy on any pullback

Tick Data

As I explained, the Inverse H&S is too obvious, there has to be some head fake and a failure of the pattern should get technical traders to take the other side of the trade, that would set up a more bullish outcome n my view and the TIK hart's data is right on time...
Uptrend n TICK is broken, we should see an EOD pullback, likely back down through the breakout level, I still remain short term bullish, but the game must be played.

Financials

 FAS Financial Bull confirmation 1 min

 FAS confirmation 5 min

 FAZ-Financial Bear, coming very close to a false breakout which would send t much lower.

 FAZ 1 mn confrmation

 FAZ 5 mn confirmation

 XLF-Finanials, I captured these last, so the 1 min negative divergence makes sense to me.

XLF strong 15 min.

As I mentioned earlier, expect volatility and head fakes around important levels of support/resistance.

The DIA/QQQ are showing 1 min negative divergences, and they have broken out through the inverse H&S, the pattern is too obvious, but technical traders are taught if a pattern false, you take the other side of the trade, so a break back below the breakout point may very well be the head fake I've been expecting today. However, the long term harts remain very strong, so a head fake is what  expect, it's probably what we'll see, volatility should be high, but the path of least resistance after the games is indicated as up.

GLD Update

That may have been it for GLD's bounce...

Break Out or Head Fake Still to Come?

 DIA breaking even the 30 min chart with positive RSI/MACD

 DIA 1 min confirmation

 DIA 5 min confirmation

 However volume is troubling for a breakout

 QQQ  1 min non-confirmation

 QQQ 10 min non-confirmation

 Lack of volume

 SPY 1 min confirmation

 small 5 min neg. divergence

SPY breakout, no volume...

This Inverse H&S is too obvious, thus my earlier warning of a head fake, perhaps the pattern will show a failure as a head fake, but volume should pick up and it's not, thus until it does, I'd still be on the lookout for some Wall Street game.

FCX-Copper as a leading indicator

FCX/Copper have often been a leading indicator for the market as mentioned last night.

This is a 5-day chart and shows some of the bigger calls copper made as a leading indicator. In 2009 copper bottomed before the market and was already rallying before the SPY (in red) even bottomed. In Q1 of 2010, Copper refused to rally on the second peak, in a negative divergence with the market. Late 2010 Copper topped before the market.

 Here's Coppers Trend Identification, red arrows are lower highs/lower lows (down trend), the last 3 days have been noise signals and noise almost always precedes a change in trend.

 30 min 3C FCX leading divergence

 3C confirmed the downtrend on the 15 min chart and is now n a leading positive divergence.

 Here using my trend channel, there was a buy to cover signal at the green arrow, the red trendline is the Trend Channel's lowest low and thus the point where a signal is given on the close. ADX also turned down from 67, which indicates a change in trend.

Here are some of my daily Demark custom indicators with buy and sell signals.


Transports Giving a Strong Signal

 IYT Dow Jones Transportation Index-30 mn 3C leading positive divergence

Dow Jones 20 Transports also giving a strong 30 min 3C signal, transports are about on par with the Dow's percentage gain today.

GLD Update

 GLD 15 min chart, GLD has lost more ground at nearly a 3% loss.
GLD has taken out yesterday's gains and the close from Tuesday, it is a natural area to expect a bounce and short term 3C is indicating a bounce, which makes sense with the last market update, this may give you good positioning on a trade like DZZ.

Quick Market Update

 DIA 1 min, we are nearing the inverse H&S breakout trendline seen in red, as I mentioned earlier, expect volatility around major support/resistance levels, this is a major one and the 1 min 3C is indicating either  pullback or a consolidation, that is normal, but we also want to be on watch for some sort of head fake which could be an extreme move.

 The 30 min chart is still very positive, so despite the short term action, it looks like the most probable outcome s a breakout and move higher, still the Wall Street shakeout game will be played. They never give up anything obvious easily.

 The Q's near the breakout level on a 1 min hart, suggesting the same pullback/consolidaton.

 The 30 min hart is very positive, this trumps the 1 min chart, the longer the timeframe, the more important the signal.

 The same is true of the SPY

 And its 30 min chart.

The 50-bar 15 min average has been a zone of resistance, it's one place a pullback may run to, although it's hard to say exactly what Wall Street may do for a head fake.

I'll update other signs and signals

KCG Long Trade Follow Up

KCG continues to move in our favor, up 8.2% today.
 Daily chart

A promised, here's a tight stop of a 50-bar sma on a 5 min chart. For those who are willing to sit through a consolidation and looking for a longer term stop, I would suggest the $11.20  area.