Thursday, June 16, 2011

Gold Margins Lowered in After Hours

I don't know what the catalyst for this one is, some say it's a move to regain credibility, in essence a show that the COMEX is NOT manipulating precious metals. I don't buy this theory, if they wanted to gain some credibility, they should loosen up the margin requirements on silver which they hiked 5x, even after the silver rally was dead-I guess one for good measure.

In any case, they lowered initial and maintenance requirements by 10%. We'll want to watch 3C very carefully to see if this is going to provide legs to a trade. Right now GLD is in a very tight consolidation that implies a directional breakout one way or the other. GLD is also sitting right on the short term trendline, a break of which could send gold lower.

Here's the charts

 The short term trendline

 The long term trendline.

 The 150-day moving average-a buy at the 150 sma is pretty much a no brainer

 Here's the consolidation with a directional move quite likely. The first move is not always the real move as we know.

And here Bollinger Band's volatility is very narrow, again suggesting a directional move coming very soon.

In other CME news after hours, they hiked margin rates on Corn by 50% and Lean Hogs by 66%, also raising margin on Wheat, Soy Beans, Lumber, Dry Whey and Cattle. The hikes sound a little political.

The Miners Trading System Update

Tonight's signal, like last night, remains long DUST for both trading systems.

Here's a look at what DUST did today

That's a pretty nice 1 day gain and look at the volume on the move! Considering how choppy the overall market has been, this is a pretty nice swing trend.

I've had a couple of email questions from members who want to add a trailing stop as the system's signal is always after market and the execution of the signal is on the open the next day, this creates a short lag, I don't think it's very significant, but for members who want to utilize a trailing stop, you might try a 6-day simple moving average on a closing basis.

It's important that this stop is used on a closing basis and not intrday, intraday would have taken you out of the trade yesterday and you would have missed the nearly 5% gain today. I haven't tested the system with a trailing stop, I may do so and see if it performs better, but one of the nice things about this trading system is that it's user friendly for those who can't watch the market all day. The signals come after market and are executed on the open the next morning-an easy system for those who have jobs that don't allow them to watch the market.

$127.25 just about the perfect close for tomorrow?


SPY Calls as of today, note the volume and open interest in the $128s


And the SPY Puts as of today-Note the volume and open interest at $127

Putting premium aside, it would seem a close tomorrow of $127.25 (or thereabouts) would be the ideal pin.

RIMM Reports After Hours

It's not my favorite stock by far, but maybe they discounted it a bit too much.

It's looking better then the broader market going into earnings.

As always, any earnings plays are SPECULATIVE.

A Broader Example

I'm going to use FAZ as a proxy for the market 1) because it gives good signals, 2) because it's related to financials and the market is going where financials are going.

 This is FAZ (Financial BEAR 3x) on a daily chart, ultimately this is where I want to be. The leading positive divergence on a daily chart is a VERY strong signal, so effectively, for the long haul I want to be short financials and the market.

However in the shorter term, this is FAZ on a 60 min chart, it's negative and shown distribution on several occasions. This indicates to me along with a lot of other charts, that the market wants to bounce as the bear trade is getting overcrowded.

 The 15 min chart confirms the same.

 As does the 10 min chart

 And even the 1 min chart today on the sell-off. It seems FAZ is being distributed near highs.

Looking at the last time the market reacted to the end of QE1, there were some steep plunges, but also some nice counter trend rallies.

I think this time is different then the end of QE 1, there's a lot more bad news to be considered.

However, the market doesn't fall straight down and the last 5 or 6 day, the market has definitely lost the downside momentum it had going for it. I think it's possible that the calls and puts for that matter are going to be pinned in a narrow range. Who writes the majority of options? Most retail traders buy them, not write them, so who profits from pinning them and seeing them expire worthless?

If I'm close to on track here, then tomorrow options and puts which are close together and can easily be pinned together near the highest volume and open interest, are pinned. Perhaps the start of the week, we see a counter trend move in the market.

To be clear, my bias is VERY bearish, but a bounce can and should be traded and will ultimately set up some great positions on the short side.

OPEX Tomorrow

Not just option expiration, but Quadruple Witching.

Here's today's SPY Calls

Heavy volume and big open interest. If I had to put money on it, I'd say those $128 calls will be pinned tomorrow.

Look at where the market sold off today..
At the high of $127.97


Looking at the 3C charts for the SPY from longest to shortest (longer charts have greater implications).
 A huge positive divergence on the 60 min chart...

 A Strong divergence on the 30 min chart

 We make new lows today on the 10 min chart, but into a positive divergence on a relative basis vs yesterday's lows.

The same thing on the 5 min chart...

Just thinking out loud, but if the sell-off are being accumulated and the idea is to pin the market (SPY $128 is just one example), then Monday (after Op-Ex) could possibly be a pretty exciting day.

I think I have an idea of what to be looking for.

Financials Update

FAS was one of the first to show the bottoming of the downside move... Lets take a look a look currently
 FAS 1 min 3C positive divergence

 The 5 min chart is now positively divergent compared with yesterday's lows.

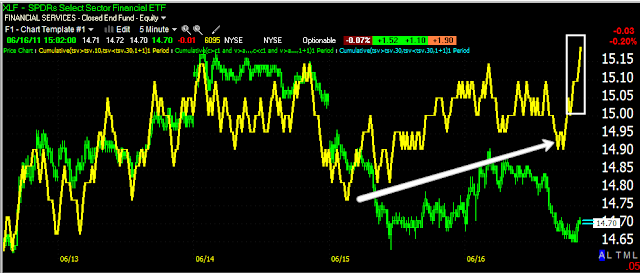
 As is XLF's 5 min chart. It seems like some very strong shakeout behavior is being run through HFT algos.

The longer term charts in FAS/XLF remain positive. I have a feeling Monday may be an exciting day.

FSIN Revisited

FSIN is a short position identified after it had broken down, we were looking for $7.20 on a bounce to short FSIN and it's a position that I've considered a long term position, there have been some bounces and moves against the position but all in all, the daily gyrations weren't of concern, the larger pattern was.

 The weekly chart with a massive top.

The white arrows were our chance to short FSIN at $7.20. So far the gain on FSIN is 33%, but I expect this one to go way lower. The point is there were several days in which FSIN moved into the green by 7 or 8%, the idea of the trade is a long term trending trade and unless I see something that suggests something major has changed, I want to keep exposure to this position.

That's the idea behind the short candidates I've been positing. They need to be viewed as long term trades and daily gyrations can't have you stopped out, otherwise I would have stopped out of this trade 3 or 4 times already. The key to doing this is allowing a wide stop and making sure your position size doesn't exceed a 2% of portfolio loss if you have to cover the trade.

Again, I refer you to last night's post at Trade-Guild.net

Extreme Volatility on the TICK

I have rarely seen action like this before on the TICK Index.

From +1000 to -1250 in 15 minutes. It seems like a major HFT algo just hit the market all at once.

Financials Update

It looks like FAS may be working on a bottom here...

There are some preliminary signs in some of the averages, but FAS so far is the strongest signal

Market Overview

This market is just not responding well. Oversold signals that have often worked very well in the past, especially price/volume reltionsships, have produced some initial moves as expected in the morning, but nothing is sticking.

The market is really starting to remind me of the Lehman era.

Yesterday I listed a number of potential short side candidates. My personal preference would be to set up some of these trades on a trending basis, meaning wide stops which can be accomplished with smaller position sizes to maintain risk management structure.

I would consider these trades to be of a longer term nature and not worry too much about daily gyrations, in fact, I might only consider the multi-day charts (2,3 or 5 day) to stay focussed on the trend and not daily gyrations.

Some of the stocks from yesterday that have underperformed today and thus make for good candidates would include:ISYS, ARUN, WU, TSO, VSH, MBFI (has actually done pretty well today, but is also in a pretty good low risk area), MERC, MDR (another that has done okay, but looks to be setting up well), NETL, TTMI, PCH, GBX.

The trick to these trades is to view them on a longer term basis, there will be bounces, daily or otherwise in even the worst of bear markets, thus your risk management has to plan for and allow for these bounces by having a sufficiently wide stop. You might want to take a look at the article I wrote last night on Trade Guild looking at the ISY trade specifically, which covered risk management and position sizing.

Even if the market can recover and can bounce, these trades in the long run should pay off.

If you have questions about specifics of any, don't hesitate to emil me.

Market Update

The market has been consolidating in an obvious triangle for the last hour or so.

 Trader's expectations would be for an upside breakout, so we have to look at the possibility of this being a head fake shake out.

The TICK chart has recovered faster then the market so this may be an early indication of a shakeout.

3C has plunged on the 1 min scale and hasn't shown this to be a false break as of yet, but the longer term charts from 5 min and up, still remain in a positive position. I'll be watching for any signs of a positive divergence.

FCX Possible Trade (LONG)

 FCX 5 min chart of the range-similar to a small inverse H&S bottom

 FCX 1 min 3C Positive and leading positive divergences

FCX 5 min 3C positive and leading positive divergences.

Look for a breakout above $48.70-$48.80

USO Update

USO looks like it may attempt to try to retrace some of yesterday's breakdown decline
 USO daily chart-we aren't seeing margin induced follow through selling today

The 5 min 3C USO chart showing some recent positive divergences. Look for a breakout of this consolidation area around $36.65-$37.75

A Cats and Dogs Trade Idea-CSUN (Long)

CSUN has lost a lot of ground, over the last several months, it's starting to show some signs that it may be ready for a relief move. The volume isn't bad in this one, but the price under $5 makes it speculative.

After a pretty straight line downtrend, it's moved into a consolidation pattern on a 3C 30 min positive divergence.

I'd look for a possible break below $1.82 as a potential false break before the move starts. Or a breakout above $2.00. As it stands, it can be bought here as long as you use proper risk management. On these speculative trades, I prefer to keep my exposure down to about 1% of portfolio (not including margin).

The nice thing about these C&D trades is they can move to double digit % gains in a day or two. Some even hit tripe digit gains within a week.

QQQ Lagging

 QQQ 1 min-accumulation at the lows yesterday and at 10 am today, currently looks to be consolidating

 5 min 3C QQQ-Again, positive divergences at the same places

 The Q's need to make a decisive break above $54.50-preferably on some volume.

 Semi conductors are looking like they are preparing for a directional move.

The Tech Sector (XLK) also looks to be in a bullish consolidation and close to a directional breakout.

TQQQ would be a way to play a move up in the Q's as well as QLD.

Market Update

Here are the 5 min charts, which are a bit more important then the 1 min charts. Yesterday they didn't start to develop until very later in the day, now they are developing at an accelerated pace.

 DIA 5 min 3C-a huge uptick into the Philly Fed sell-off-currently in a leading positive position.

 QQQ 5 min, positive yesterday near the lows , but a dramatic change on the Philly Fed sell-off-also leading positive position.

 SPY 5 min 3C-A positive divergence at the lows yesterday and again this morning like all the others.

XLF-Financials 5 min 3C-Has been on a pretty solid and steady trajectory since yesterday.

Impressive

You may recall yesterday's closing update with the conclussion of yesterday's trade activity being "Look for Strength Tomorrow Morning"


The market just shook off a horribly disappointing Philly Fed Report.

Not only a recovery, but a move through the $127.50 level I've considered to be a key first step.

Philly Fed Survey

You may be wondering what that sudden spike down was all about at 10 a.m., that would be the release of the Philly Fed Survey


The Manufacturing Index was expected to come in at +5.5-an increase from May's +3.9, instead the actual reading came in at 31 month lows at -7.7 for June.

Yesterday the Empire Index gave a similar outlook, and last week and the week before multiple manufacturing measures have all been on a trajectory toward contraction.