Wednesday, July 8, 2015

Daily Wrap

Where does one begin on a day like today?

It seems a lot of market downside was either during or directly proceeding broken markets, reasons? Well beyond the tinfoil hat theories which might not be far off when you consider some of the hyperbole coming out of China as to who's to blame for their markets, lets just say, remember those very low volatility/low volume days with markets breaking every week and I said, "Just wait until things get really volatile"?

Well volatility is here.

ES 7 min chart of "V" shaped volatility, this is why I never trust "V" bases/tops or parabolic moves, not because of the broken markets, just in general.

Both the Dow and S&P closed back under their 200-dma, however that's where we started to see late-day improvement. We couldn't get through some of the timeframes I'd like to see being we had half a market half of the day.

However the SPX put in what was pretty darn close to a Tweezer bottom the last 2-days.

USD/JPY dropped by the most in over 2 years, remember this week's charts suggesting $USD moves lower on a carry unwind?
USD/JPY 2 hour chart.

USO/oil put in a larger reversal process on Iran deal problems and is starting to looking interesting for an oversold bounce trade.
 USO putting in a less sharp reversal process for an oversold bounce, the reason we exited USO short on Monday, Closing USO Equity Short

USO's 3C chart is showing more positive divergence in the area.

As to the market itself, I entered a late day SPY call position in speculative size, Trade Idea: SPY Long SPECULATIVE , I would have entered in full size if the market had more time and built stronger divergences, but afternoon trade was by and large on the positive side and I suspect the overnight charts should improve as well as tomorrow's. If that is the case, I'd add to the IWM and SPY calls, otherwise they remain speculative in size with the full core short positions all still open as the primary underlying trend is clearly to the downside despite even an impressive bounce.

Here's the way some of those charts looked...

 SPY 1 min intraday improvement in to the close.

SPY 2 min still in a positive divergence.

SPY 5 min from in line to positive this afternoon

SPY 10 min 3X trend looks like a base for a bounce here.

QQQ 1 min latte day improvement.

 QQQ two minutes chart late day improvement

 QQQ 10 minute chart from a leaving negative divergence to a relative positive divergence

 The IWM and looks like it hit stops today at the white arrow as broke below previous support

 IWM one minute chart with late day improvement in 3C as well as a positive divergence on stop run at the yellow arrow

IWM two minute intraday finally showing some movement and improvement into the close

 IWM 3 minute also showing improvement into the stopper on and close

IWM five minutes relative positive divergence

 UVXY one minute negative divergence into the close

  UVXY two-minute negative divergence leading, into the close.

  UVXY 10 minute negative divergence looking like there should be decent pullback.

VIX futures intraday also leading negative into the close.

VIX futures 30 minutes chart with an overall positive divergence but looking like strong pullback with a 30 minute negative divergence to far right.

 XIV which is the inverse of VXX showing a positive divergence into the close

 XIV positive on a five minute chart as well
 XIV and positive on a 10 minute chart looking like it should make a decent bounce.

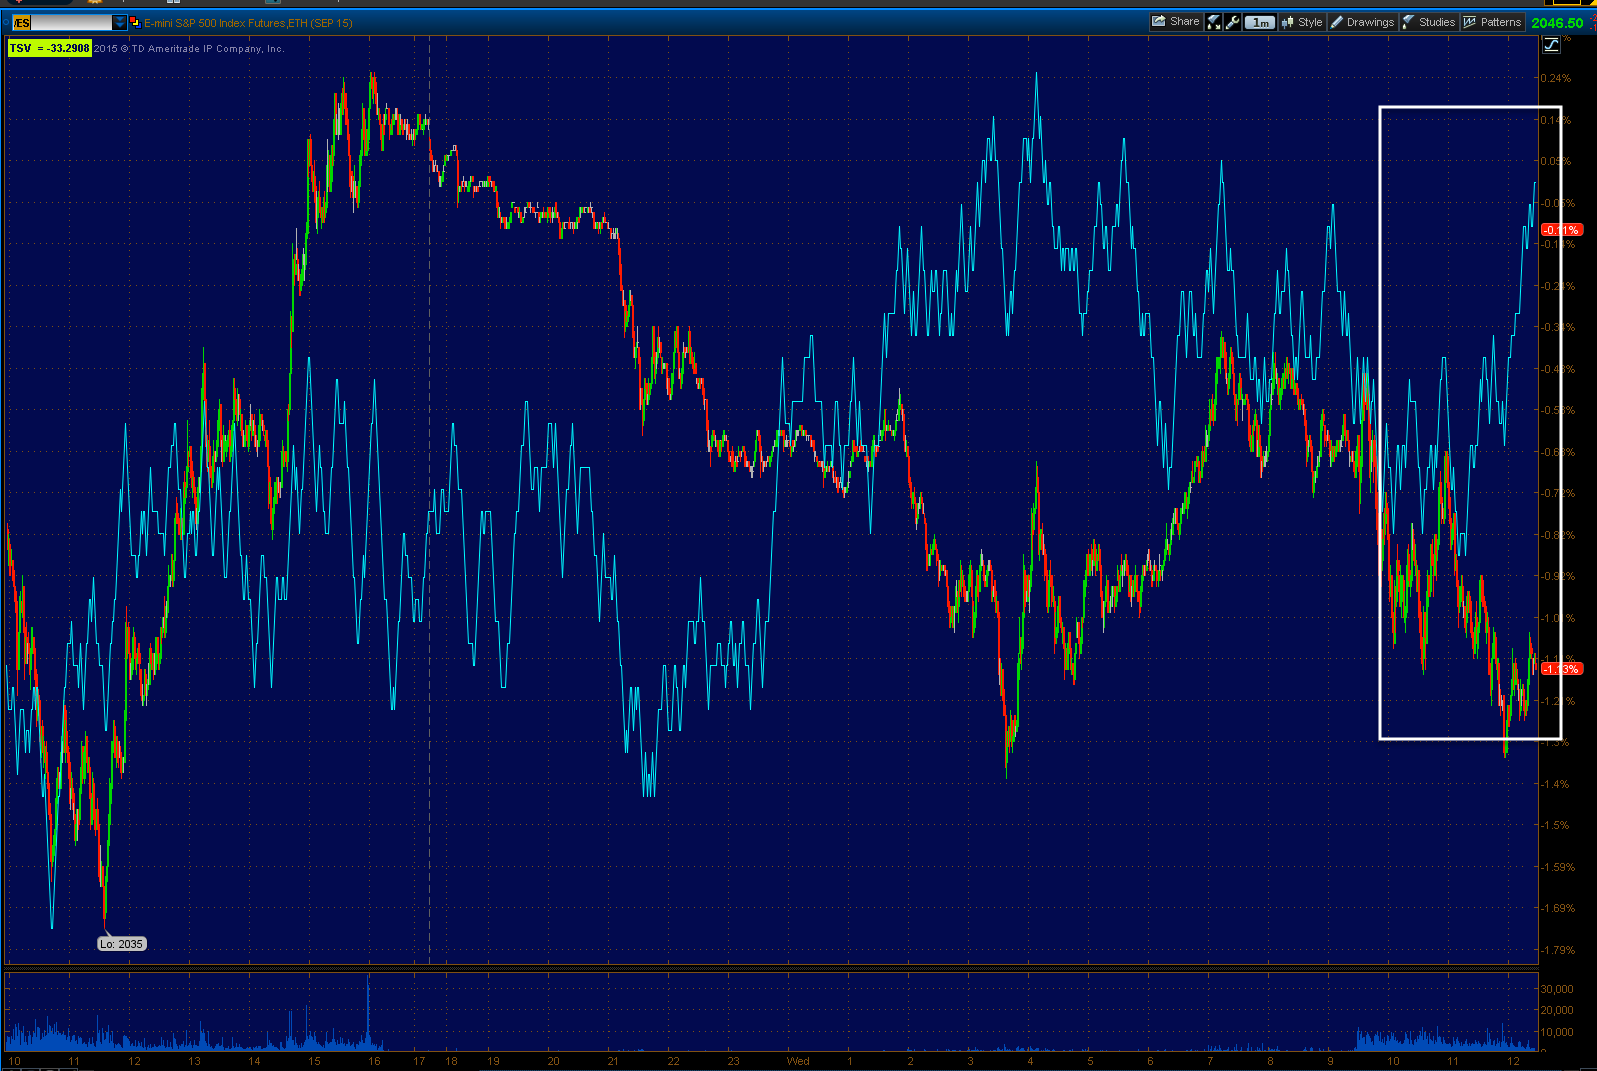
 And ES/ SPX futures with a nice leading divergence into the close. I would like to see this on three and five minutes charts as well but that can happen quickly overnight.

 The three minute chart is in confirmation which means you can go positive from this point pretty easily

 As well as the five minute ES chart

This 10 minutes ES chart is reflecting a positive divergence from earlier in the week.

I'll be looking for additional strength to give me reason to add to the short-term bounce positions, but don't forget I do not consider this a risk on move but rather any bounce would be a risk-off move allowing Wall Street to unload shares and /or short into price strength which is the same thing I would be doing. All core / trend shorts are still open.

If Futures should improve dramatically tonight I will post them.


Trade Idea: SPY Long SPECULATIVE

I'll be adding a half size July 17 SPY $205 call, the charts haven't had enough time in the last hour to be where I want them, but they sure look like they are moving that way. If this continues early tomorrow, I'd like to add to both the SPY and IWM calls.

Quick Update-CHARTS ARE STARTING TO COME ALIVE

We are finally getting some positive divergence as the NYSE re-opens, I wouldn't say we have repaired the last 2-days damage, but we are moving in the right direction quickly. If this keeps up, I'll likely add to the IWM call position, maybe some others, if this keeps up and posts some solid divergences, not just rapid improvement.

Leading Indicators

Leading Indicators are incredibly flat.

Here are just a couple of examples which are right in line with underlying trade today.

 HYG High nYield Corp. Credit (blue) vs the SPX. This is one of the go to levers they pull to ramp the market, we have seen recent divergences suggesting a bounce is in the cards such as...

3 min HYG positive divergence set up for a bounce cycle.

However intraday, very little movement in HYG itself and just as much in HY Credit.
 Absolutely flat intraday vs the SPX and remember this is the first time it has led to the upside since May coming in to this week.

HY Credit positive divgerence for the first time since May, but totally flat today.

 Our Pro sentiment has a slight positive, but nothing like the last week or so, also pointing to a bounce,

Pro sentiment positive coming in to this week with deterioration since yesterday, still roughly positive though.

This makes perfect sense with the lack of any movement in the 3C charts which has reflected the lack of intraday movement in the market.

A head fake below yesterday's lows could put together some accumulation, I'll be watching for it, otherwise I'll likely be looking at closing UVXY short and just let the core shorts take over. More as it comes available.

Quick Market Update

I guess we can't be too surprised at the intraday luck of market movement considering events.

The 1 min intraday charts for the most part are still positive, but beyond that, barely anything is moving.
 SPY 1 min intraday still positive, but not much beyond.

ES 1 min intraday still positive, again not much beyond other than the 10 min chart which is part of the larger divergence we had before or going in to yesterday.

IO'm going to check leading indicators, but it seems this market weirdness is putting a lot of traders on the sidelines understandably.

Market Update and VXX/UVXY Follow Up

The reason I can't condone a trade in the SPY, IWM, QQQ, etc beyond the minimal risk we have open in IWM calls, are these charts...
 SPY 1 min positive divergence, but there aren't many/any confirming charts, at least not yet.

 SPY 2 min is in line, not positive.

 ES/SPX futures as mentioned are leading positive 1 min

The next timeframe 3 min is perfectly in line, not leading.

UVXY looks a bit different.
 UVXY 1 min leading negative

 2 min leading negative

 VXX 5 min negative

10min with the stronger long term positive divergence and a more immediate negative divergence.

15 min UVXY negative divegrence

Trade Idea: Adding to UVXY Short

I know that this would seem to be an endorsement of the market long being VXX/UVXY move opposite the market, we do have a partial position long IWM calls and I am yet to add to that.

I am adding to the UVXY short because the charts look good, they are in place. While the market's charts are moving in the right direction, they don't show the same level of objective evidence as the VXX/UVXY/XIV charts.

Thus the only long exposure right now is really the UVXY short which I'll fill out now and the partial position in IWM calls, which I will fill out IF the charts jump in line and I have objective evidence to back up the trade.

Remember UVXY short is a VERY short term trade, it's larger overall divergence is positive, which overall is negative for the market.

As Always, Beware the F_E_D knee-jerk reaction

Whenever we have an F_O_M_C or F_E_D related event, I ALWAYS warn and have for a half dozen years to beware the initial knee jerk reaction which can last minutes or days. We not only have the minutes from the F_O_M_C's June meeting, but we also have:
San Francisco Federal Reserve Bank President John Williams outlook speech in Los Angeles.

Both at 2 pm today.

Quick Intraday Update: Movement

While we are seeing some intraday divergences now in multiple assets and averages, we are also seeing them starting to form in Index futures, here's ES/SPX futures as an example...

 Intraday ES positive divergence from in line earlier. NQ and TF are also positive as are SPY, QQQ and IWM. This is just a first step and some movement, it's not a trade signal, but at least we are getting some movement now.

 The Intraday NYSE TICK Index has been flat from the earlier downtrend, mostly in negative territory, but flat.

Our Custom TICK indicator is showing improvement as well in its histogtam below intraday.

USO Update

Earlier in the week we closed out our USO equity short, Closing USO Equity Short and USO P/L and Follow Up both of which why I thought it was a good time to take our USO equity short with no leverage off the table and protect a +15% gain. Don't forget to check out the reasons why if you don't already know.

This morning's EIA petroleum report came in at ANOTHER consecutive (2 weeks now) build in inventories, although not a big one at +384k bbl. The Cushing storage facility also saw a build, as well as gains in production. The reaction to this morning's oil inventories release...
 USO intraday with a decline at the EIA release this morning.

The daily chart is back inside and below the $19 level which means, it "can" start to finish the work that needs to be done to finish the base, but for now I suspect volatility first and likely a move down toward the bottom of the range. We may be able to get in some quick trades on the volatility headed toward the bottom on a potential oversold bounce soon.

That's the direction (oil bounce) we were headed in before this morning's EIA, but the pullback may actually help facilitate an oversold bounce which I'd prefer to play with options given the nature and R:R ratio of the move (profit potential being limited).


The leading negative USO divergence (red) that sent USO lower and the recent short term oversold condition developing with a positive divergence. That took a little bit of a hit today, but lower prices are usually where we see accumulation so it's very possible this sets up a USO oversold bounce trade. I don't see enough confirmation or reversal process yet, but I wanted to give you a head's up as it can build in quickly and if I put out a Trade Idea, I want you to have the back story so I can get it out quickly.

As usual I'll be looking for a strong leading positive divergence at least out to the 3 - 5 min chart, depending on how strong it is.