Monday, June 25, 2012

UNG Pullback Likely

In the equities model portfolio, UNG is the only Primary trend long position and is one of the few stocks I like for a long term long position. However if we look at the 4 stages of a price trend (this can be applied to 1 minute charts or 5 day charts), UNG would technically be considered to still be in a stage 1 base. If we consider the trend from the low to the high, approximately 60% of the trend is what we would call the easy money which consists of stage 2 markup and very early stage 3 distribution. The stage 1 base and stage 3 top are the most volatile parts of the trend and typically account for 40% of the trend from low to high, for instance, the base may account for 15%, the actual trend may account for 60% and the top which is typically the most volatile, may account for 25% of the move from low to high.

Thus I consider UNG to still be in the base and the second most volatile part of a move from base to top, the top being the most volatile and the easiest money being that 60% or so in between.

UNG looks to me as if it wants to pullback in the near term. I have about a 9% profit in UNG right now. How you choose to deal with a pullback will depend largely on your trading style, while some may choose just to ride it out, others may want to move out of the position and try to buy back at  a lower price.

One caveat to the % trend estimations above, UNG is in my view a unique case. I believe it is looking at a secular change in trend and as such may offer much more upside than you might calculate using my estimations of the cycles of a trend vs. how big the UNG base is. A secular trend is bigger than a primary trend or what we commonly call a bull market. For example, from 2002-2007 the SPX was in a bull market, from 1980 -2007 the SPX was in a secular bull trend. I can't say UNG will see a 27 year trend develop, but I do believe it will be bigger than a stock's average primary trend.

The charts...
 UNG's long term 5 day chart, volume alone shows a recent change in character, in the past I have outlined a number of reasons why Natural Gas may be ready to enter a new bull market.

 This is what I view to be the approximate base in UNG with a break out above the red trendline sending UNG in to stage 2 mark up.

 Rate of change also shows a recent change in character in UNG.

 The 60 min chart shows a very positive looking base area

 However the 15 min chart looks like UNG is ready to pullback, this is not unusual volatility for base building.

As for timing, the 2 min chart looks like a pullback will start very soon.

I can only guess at a pullback target at this point, I would think the $16.50-$16.75 area would be reasonable.

The Trend Channel would suggest $15.75 would be on the extreme end of a pullback.


Financials Update

This is not only part 2 of the BAC update just posted, but also has broader implications for the market in general.


 XLF 2 min intraday-when looking at a suspected pullback (vs a change in trend), we look for positive divergences in to lower prices that let us know that the shares are being bought at lower prices, this is highly suggestive of a corrective or tactical pullback. In a trend reversal we would not expect to see positive divergences, but rather leading negative or in line readings. Since the pullback started, there have been positive divergences in Financials on the 2 min intraday trend; today makes a new leading local high.

 The 3 min chart showing the pullback signal and the same positive divergence in to the pullback.

 The 5 min chart is for the most part, in line. It seems the 3 min positive divergence hasn't made it to the 5 min chart yet. My gut feeling is that there's more downside in the pullback in which we should expect to see stronger positive divergences in to lower prices.

 The 15 min trend since the May 1 top showing a positive divergence in the bear flag/pennant and at the  bear trap break below that pennant that sent prices higher. After that a negative divergence, part of the pullback signal. I believe this negative divergence was stronger than would normally be seen because price in the SPX was above major resistance which would have caused short covering. To create a pullback while dealing with short covering, I believe smart money would have to lean on the market (put more pressure on it) to create the pullback. There's not much reason to create a pullback when you are already in short covering territory unless you want to trap more bears and create a stronger short squeeze. For example...
Looking at the SPY, there was a top in place.
A) A break below the top would have brought shorts in to the market, after the initial break a bear flag/pennant formed. Traders view this as a consolidation/continuation pattern and expect the market to break down creating a second leg down from the point of the break below the pennant that would have had a target of approx. $118.
B) Part of a Crazy Ivan shakeout ( a shakeout in both directions) not only would have caused some shorts to cover (creating trading profits as well as volume rebates), but the failure of the breakout would have confirmed in bears minds' that a test of resistance failed and it is safe to short the SPY again.
C) Price breaks below the pennant as traders expect, they have confirmation and many will wait to short the SPY until they have price confirmation (chasing). That move quickly was revealed as a bear trap, 3C signals warned we would see such a move weeks in advance. Shorts would start covering as price moves up.
D) The SPY once again looks like a failed test of resistance, another favorite area for traders to short the market.
E) The SPY breaks through resistance causing shorts to start covering.
F) The break below support (former resistance) once again gives shorts confidence in shorting the market again.

The market makes money by making as many traders as possible wrong at any one time. There are at least 5 major moves described above that would have had traders on what they perceived as the wrong side of the trade and those are just the major moves. This is one reason I'm hesitant to short initial breaks from important tops, the volatility shakeouts are just too extreme; Rather we started shorting the market while traders were still bullish in March on 3C negative market signals, as a result, none of the core shorts have been stopped out and all 6 core short positions are at a profit of up to 25% using no leverage. This is the difference between chasing the market (which is what Wall Street wants) and using your greatest advantage over Wall St., your ability to pick and chose when and where you are in the market and let the trade come to you.

Carrying on with Financials...

The 15 min chart close up of the reversal, we are now starting to see accrual of positive divergences now show up on the 15 min chart as it is starting to lead in positive position. I can't tell you how many Titter messages have been forwarded to me of traders entering the market one day and being stopped out the next, over and over again.

Thus far, financials look very much like they are in a pullback rather than a trend reversal. As mentioned above, I believe the reasons are more tactical than anything else, "make as many traders wrong at any one point in time" and we have seen numerous smaller patterns set up that appear to be bear traps as well, we reviewed several of them today.


BAC chart Request

I'll be following this up with Financials, after all, the market, then the sector have the most influence over most stocks on any given day.

 1 min BAC seems to be mostly in line, slight positive today

 Since the same pullback signal I saw for the market last week, BAC's 2 min chart is leading positive in a flat trading range today

 The 3 min chart which has been largely in line with price is in a leading positive position as it did not move lower to confirm the gap down today.

 The 5 min with the signal for a pullback from last week and the 5 min in leading positive position.

The 15 min chart has largely been in confirmation of the trend, today's gap down was not confirmed by 3C, therefore the 15 min chart is in leading positive position.

It would seem to me the pullback signal we saw last week was intentional and is being used to pick up some shares on the cheap as well as set  a number of bear traps.


Went with GLD July $155 Puts

I decided to go with July as I recall the August puts not moving much even with GLD moving down.


Looking to Re-Enter GLD Puts

As you know last Friday when I closed the remaining GLD puts, it was because I don't want to sit through a bounce and would rather take the profit and re-position.

I am only considering a 1/2 size position as I feel there's a chance GLD could run a bit higher, but I am going to open a position because my original analysis as of Friday suggested a bounce only in GLD, thus far GLD is on track with my expectations from Friday. I'll be looking at August puts, I'll post which ones when I've decided.

GLD charts...
 As explained several times, there may be a very lucrative trending long position developing in GLD, however we are not there yet. For the time being, this 60 min negative divergence is the trend I want to trade.

 The 1 min chart starting to fall apart. I'm looking at 1/2 size position as this also could signify a consolidation.

 2 min chart leading negative this afternoon.

 3 min chart never really got far.

 5 min chart is in line at best and turning south.

The 30 min chart is similar to the 60 min, trading shorter term with the trend would dictate a short position in GLD. Since there is support not too far away, I personally would not consider the trade worthwhile without sing leverage, thus the puts/options.


What Are Risk Assets Saying?

With so many seemingly small stories with huge implications passing over the wires the last week or so,  I am very interested in how risk assets are holding up.

Some of the stories that are far more important than they may seem:

-Germany taking a more nationalistic/populace approach to EU bailouts ahead of the EU summit

-The ECB's SMP has been virtually dead silent in the secondary EU sovereign debt markets, now they are starting to officially speak openly about what we have witnessed as ECB policy over the last several months, namely the ECB is backing away from supporting yields.

-Greek politics may be about to be thrown on its head once again

-Spain and Italy are perhaps within weeks of the breaking point

-The EU's permamnent bailout mechanism still hasn't been ratified, the EFSF only has about $200 bn of dry powder, likely not even enough to cover the Spanish banking bailout

-Evidence is finally clear that China is a lot worse off than they have portrayed

-The EU spirit of cooperation is disintegrating when it is needed the most-is Germany about to wash their hands of the EU?

-Forget Iran for now, Egypt and Syria are becoming far more interesting and potentially more dangerous

As for the underlying Risk Assets...

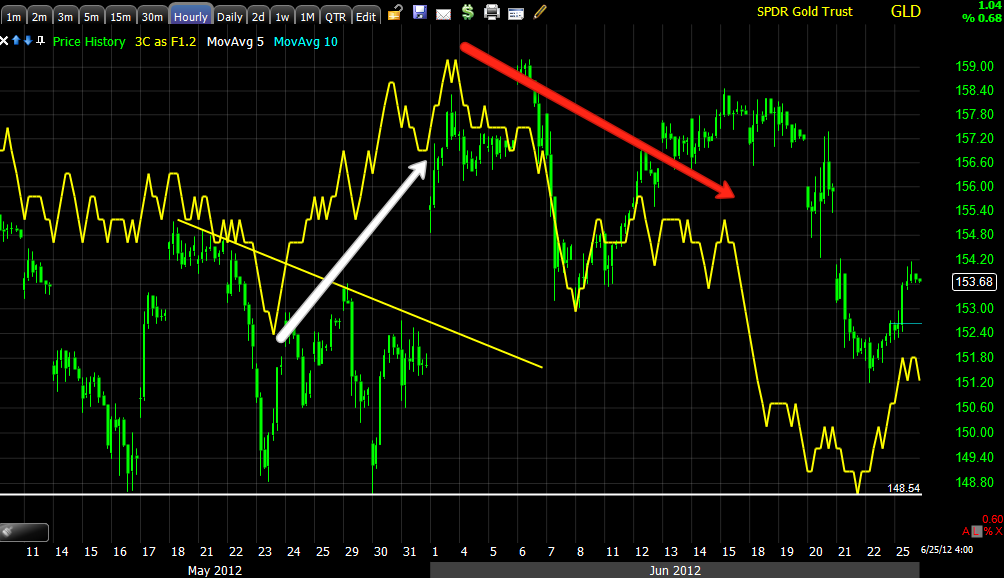
 Commodities are performing much better than the SPX today, however I feel that is because of gold, which I believe to be on a technical bounce, not a fundamental change in near term character. Oil is also contributing, but you know why.


 The typical correlation is broken today as you can see, on a longer term basis since at least October of last year, commodities have been underperforming badly, this was the hint something wasn't right in opaque China.

 High Yield Credit for the time being, is at least holding up, typically this is one of the first to be sold off in a risk-off environment.

 Longer term vs the SPX, the question is, "Does HY credit hold or is it about to round over?" There can be huge changes in a single day.

 High Yield Corp. is holding up better today

 It too is in an overall better position, but the same question remains as HYC credit is above its long term downtrend channel.

 Yields outperformed easily Friday, they took a hit today

 For purposes of the sub-intermediate trend, we have a neutral reading here.

 The $AUD in line with the SPX, I suspect China is affecting the $AUD.

 Longer term, the $AUD is barely outperforming.


 Euro today... It remains to be seen, but we had earlier signals of Euro support building in and dollar weakness.

 Sectors- Energy showing a tiny bit of relative momentum at the last 2 hours of the day

 Financials aren't doing much, the downgrades Friday of major EU and US banking institutions will have negative liquidity effects.

 Tech is not performing well today

 Sector rotation between Friday and today, obviously we see de-leveraging today, but Industrials & Basic Materials are holding up.

Intraday Sector performance-nothing too exciting.

Basically I'd call this "worry" and this is exactly why I kept my core short positions as no one could predict something like the Syrian/Turkish news.


OR.... Oil is responding to this...

One of my passions is world politics (it use to include US politics as well, but honestly I find very little of interest in our two party system, obviously the platforms differ, but the message is the same, "MONEY" and I am saddened by the competent and talented people who could serve our country's best interests, but will never see the political light of day because of "K" Street). In any case, it was just last night in the "Week Ahead" post I mentioned the Syrian/Turkish trouble. I don't pretend to be a news service and I don't put stories on the site unless I feel they have some significance to the market either immediately or as background information for something that I feel will develop and effect the markets.

From last night,

"While Turkey is a NATO member and enjoys certain benefits should they request them, Syria doesn't stand alone as it has very valuable bases and strategic importance to both China and Russia, the 3 countries are planning the largest scale war game EVER."


"Oil will be interesting, after seeing the FX open, I expected oil futures to look worse based on correlations alone, but based on the fundamentals of MENA, it's hard to argue against oil seeing support from market uncertainty in two situations that could be quite a bit bigger than how they first appear."


There are many rules and "mottos" of the market that have stood the test of time such as "Trade with the trend", in this case perhaps more importantly, "It's time to buy when the missiles fly".


This isn't a reference to the market liking war, although crude did very well during the Iraq war (#2); it's a reference to the other saying, "The market hates uncertainty" and when war starts, it removes the uncertainty of the build up to war. 


I would file this under, "Uncertainty"...


Turkey claims Syria has fired on a second Turkish jet, also says the act won't go unpunished and invokes NATO articles 4 and 5. Turkey also says Syria fired on a Turkish search and rescue plane.


More From Reuters


The timing seems about right for the intraday move in oil.


USO Update

USO was another Follow-up/ Trade idea from last Friday , I opened a 1/2 size position in July $30 Calls...


"I'd love to sit and watch USO for a better entry, but I don't have that luxury, so I'll be entering a speculative position"


The last update from Friday started like this...


"This update from June 20 speculated that the descending triangle (of which we have been seeing a LOT lately) was setting up a bear trap.

From the update:


"This recent descending wedge is a pattern we've been seeing a lot lately, there have been some good head fake moves off these. Today we saw the downside move that technical traders expect from the price pattern, so the question is, is it setting up  bear trap?"


In any case, as you'll see, USO's drop today didn't do much damage, in fact it ironically only made a new low by 1 CENT! This is another reason I view support and resistance as levels or areas rather than EXACT points, I'm guessing that one cent made a world of difference as far as taking out stops/triggering new short orders. It appears to me that USO is seeing some afternoon lift from the negative divergence I posted earlier in the $USD, when the dollar falls, oil generally appreciates in price and vice-versa.


 This was the original idea-a bear flag/pennant that had already broken below support of the consolidation, triggering a flood of orders (likely almost all short orders because of the implications of the technical price pattern). Today's low was 1 cent below last Thursday's low, so although it seems like a very bearish move in USO today, it has only lost 1 cent from the last 3 day's support. The red arrows show how Technical traders are taught to interpret the price pattern, this is why I suspected a bear trap.

 Look at the volume as the bearish consolidation pattern was broken.

 Today's intraday action is actually bullish looking, very similar to a rounding bottom.

$USD 1 min trend and intraday leading negative divergence.

 $USD 3 min intraday leading negative divergence today as well as a relative negative divergence.

Also the 5 min chart seen earlier that shows no confirmation of the $USD's gap up with plenty of downside confirmation (at the green arrow).


I'll be sticking it out with the USO calls, I haven't made a decision as to whether I may add to them or not. I'd like to see how the market develops a bit more and decide where capital would be best allocated.


BIDU Update

BIDU is another I'm getting a lot of emails about, which is a July $110 call entered Friday. A lot of the questions revolve around adding to BIDU, I prefer not to. BIDU had a positive divergence out to 15 min, it looks like a decent short term bounce or relief rally candidate, but as the positive divergences son't reach out past the 15 min chart, I don't consider it to be a longer term trade, thus the July expiration instead of August.

Here's what BIDU looks like today...

BIDU has that same bear flag/pennant we are seeing everywhere. In the BIDU chart post from Friday I showed a chart similar to this and said,

"There's always the chance (even with BIDU moving up as I suspect) that we will see a downside break which sets up a bear trap. Recently with these price patterns the chances have been about 50/50 that there's a downside break first and then an upside breakout creating the bear trap. I'd estimate 10% of the time we see a Crazy Ivan which is a shakeout in both direction before the real move establishes itself."


So I'm not too concerned with BIDU right now, I don't think BIDU specifically broke to set a bear trap in this case, I think the market sentiment caused it, but I do think Wall Street will use it to their advantage.


 Even though the 15 min positive is quite large, it doesn't reach the 30 min chart. You can also see the break below support mentioned above from Friday.

 Intraday the 1 min chart showing improvement which is what I'd expect to see in the setting of a bear trap.

Check out the volume, you can see why it the break below support can easily be used as a bear trap and accumulated without drawing attention.

This is the largest volume in about 2 weeks as BIDU crossed below support, that's a lot of supply on the market at cheap prices.

 2 min intraday leading positive

 3 min leading positive today

5 min remains in leading positive position.


As to adding, I prefer to just give the trade some time to work, as mentioned when first entered, it is a speculative trade, I don't want to increase the trade size just to average down, unless that was specifically part of your risk management (to allow room for a break below support/bear trap), while I considered it to be a possibility, it was not part of my risk management planning.