That's what I would call it and maybe it has just been so long since I've seen it like this that I don't recall, but in many ways, this seems to be one of the most volatile markets I can remember and it hasn't even really gone in to full on panic mode yet.
Much of the volatility isn't as evident in stocks as other areas, although I'd definitely say the volatility between the ups and downs and intraday moves is certainly there, it's other assets like the Japanese Yen which was up 3% today to make the biggest 1-day move since Q2 of 2010 or 3 years. For a look at the overnight Yen & USD/JPY volatility (not only after the BOJ statement, but after that around 3 a.m.), check the pre-market post appropriately titled, "
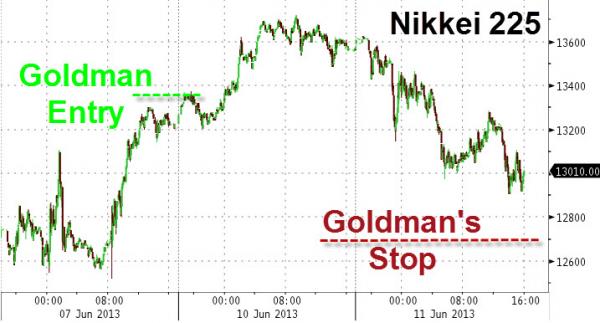
Goldman Strikes Again" as you might remember their weekend call to buy Nikkei futures ahead of Tuesday's BOJ meeting...
If you took Goldman's call, as usual, you'd be upside down,
Wall Street doesn't give out free advice, not that is useful for you.
Before we go any further, I thought we might put things in perspective, this may change how you feel about positioning, having some wider stops and sitting through a little volatility because these Leading Indicators have never been so disconnected from the SPX (in green) as far back as I can remember.
Risk assets should move together, commodities above are a risk asset, they stopped moving with the SPX because of a global economic slowdown, however stocks have been supported by QE, but that's just about to wrap up, there's some reversion to the mean and then there's actual fear and panic.
"Credit Leads, Stocks follow", then this new 2013 low, the lowest of the year in High Yield credit vs the SPX is not good at all.
FCT as a sentiment indicator is massively dislocated.
The $AUD as a leading FX asset is blown.
The Euro that use to track the market has been blown for some time.
HIO as a sentiment indicator is making a huge dislocation.
High Yield Corp[. Credit/HYG is perhaps the worst, I've never seen it this bad, we've seen some ugly moves down in the market on divergences that were 1/10th or less, of this one.
Junk Credit is doing the same.
Bottom line, this market is FRIED. If I had to allocate all my money today and not touch it for 6 months, I'd be short equities across the board and wouldn't give a second thought to any near term drawdown as these charts are so bad, it is almost silly to concentrate on anything other than getting and staying short, but the volatility can make that difficult without a good entry so we do the best we can there.
As for other assets in the Leading Indicators column...
Commodities intraday acted better than the SPX through the afternoon.
This is Commodities vs the $USD, one might say this was because of the $USD, but commodities haven't been tracking the $USD for a while, stocks either because of the USD/JPY being more important right now.
Here HT Credit, the illiquid kind shows why it is a called a leading asset, it didn't participate in the SPX rally to the left and down the market went, it made higher lows while the market was making lower lows and up the SPX went, then it made lower highs while the SPX made higher highs and down the SPX went. Right now its at an odd place because intraday it is dislocated negatively with the SPX, but it seems to have found a support area and I have to wonder whether this perhaps reflects the expectation of a quick move down (like AAPL breaking below its triangle and a quick upside reversal, that may be the message HY credit is sending us.

FCT as a Leading Indicator using sentiment as it is not correlated to the market has shown a positive move vs the SPX twice in white , the first time the SPX went up, then FCT showed a negative divergence with the SPX and the SPX topped and went down, not short term we have a somewhat positive tone today, at least it's definitely not clearly negative, again it seems to be sending a neutral message in a way that could be interpreted as a move down and reversal up-perhaps even a Key Reversal day like we saw in the SPX on May 22nd, that definitely was a Key Reversal Day as I called it that day, look at what has happened since.

Oddly the Euro has been showing some recent strength, I'm wondering if the odd strength in the AUD/JPY today was also a hint that the currencies are coming to help the market make that upside short squeeze move which is the next move I anticipate and have since the triangles formed in the major averages. The AUD, EUR and right now oddly enough, the $USD are all risk on currencies, the $USD si usually the mirror opposite, but because the USD/JPY is more important, the USD alone has taken a back seat correlation wise, that will break at some point not too far off.
The Euro at a closer look, it really looks like it's setting up as support for the market.
Here HYG (High Yield Corp. Credit) shows a negative divergence that tops the SPX in the red box. Even though HYG performed worse overall on the day, it too, like HY credit seems to have found some support and on an intraday basis in the afternoon it showed better relative performance than the SPX in to the close, HYG is an institutional risk asset so if it moves up it not only helps the market as smart money is long (for a short time), but HYG is also 1 of 3 SPY arbitrage assets the algos key off of.

The 15 min recent positive divegrence in HYG also reminds me of the SPY/ QQQ 15 min positive, note the negative before. My take on this is Institutional money has been putting together a long position in HYG at lower prices and it's of a size that would support a pretty big move to the upside, that's the move I want to load up the truck with the short positions, fill out what is already started and add some new ones. UI'll be adding a watchlist of nearly 30 candidates, I just want to see how they react in to the move up I'd expect to see, then I'll have a better idea of which ones are the highest probability, but these are all mostly from SAC capitals top 30 holdings as their biggest client, Black Rock, gave notice they are pulling all accounts and assets from SAC amidst Stevie Cohen's fall from grace as a "Market Wizard" as he's put in some sort of a defferred guilty plea to using inside information via "Professional Networks" and 19 of his associates have already been convicted. In short, he'll have to fire-sale a bunch of assets to meet Black Rock's redemption as SAC's biggest client.

HYG 3 min intraday is interesting because it looks like that support I mentioned above is actually an accumulation area/zone, the 3 min chart offers better details.
Junk Credit which is also HY traded exactly like the SPX today which is strange a it usually trades like HYG, but it also didn't lead negative so that's a slight positive.
TLT (20+ year treasuries) saw a much hotter bid today than the correlation with the SPX would suggest, as I said last week, I'm looking for a long term long position with options in TLT as I think there's something big going on there, but TLT alone doesn't have enough beta without leverage for my taste. I'd like to see the market pop, TLT drop and look for an entry there, you may recall I had an entry and I let go of it ver a week ago as it looked like short term downside was coming.
TLT longer term, A head fake move below support? You've seen the charts, it looks like Treasuries have been under accumulation all of 2013, this may be a great area to buy on a dip.
You probably recall when I posted that TLT was seeing distribution and it was coming down in the red box, at the time in my view, it was to help the SPX and the Dow make all time new highs and the QQQ make a multi-year new high, however since I think this may indeed be a head fake move, look at the 60 min positive divergence, that's a big divergence on a chart that long. So TLT will be on the buy list if/when the market moves up and TLT pulls back a bit.

OK, I mentioned already the volatility in the Ye with the biggest 1-day move in 3 years today, you may recall my articles, Currency Crisis in April where I argued that 1) the BOJ lost control when they announced a QE program that would double their monetary base in 2 years and 2) the Yen would sky rocket (taking down the USD/JPY and the stock market) and in doing so, would be one of the major catalysts in a final market break down. I think it might be interesting to go back and read both articles, I wrote them in April and it took me 10 hours, they are linked at the top of the site, but here they are,
Currency Crisis 1 and
Currency Crisis 2, I really think this is a key to the market, if anything just see what has happened since then on my BOJ analysis and if the market is in fact led by the Yen as I wrote, then I'll have not only called this market about 2 months ago, but called the exact reason why as well (we already know I've been saying the F_E_D was looking for a way out of QE, an argument I've been making since September 13th 2012).
As for the chart above, it's a 4 hour Yen futures with the large bottom I thought would develop and the heavy accumulation (positive divergence) that would develop and ultimately send the Yen higher and the market lower.
This is the current correlation between the SPX and the Yen, it was close on a daily basis, about 3 weeks ago I noted it's nearly a 1.0 correlation intraday,
how many traders are aware the Yen is what is largely moving the market?
I don't think I need to comment, can you think of one asset other than the mirror opposites like VIX and TLT that have this kind of intraday correlation with the Yen driving risk or driving fear?
This is the 4 hour chart of the USD/JPY, for the pair ( a former carry trade pair-if anyone is still caught in the carry trade here they are getting annihilated day by day) to fall, the Yen has to rise, you saw the 4 hour positive Yen divergence 2 charts above, both charts confirm each other, the Yen, as I wrote in April, will rise like a rocket, the USD/JPY and market will tank and Japan's grand experiment with the largest QE to date will have truly failed once and for all in the world's 3rd largest economy.
More on the Yen...
This is a 60 min chart of the Yen, note the leading negative divergence, if you look at the 4 hour chart of the Yen (positive divergence) 4 charts above, you'll see an inverse H&S-type pattern, that pattern looks like it needs a pullback, that's where & when the Yen is accumulated,interestingly this 60 min chart seems to suggest that pullback will come, with that
the USD/JPY should rise short term and the market with it as we have been expecting. When the pullback in the Yen is done and the 4 hour chart takes over again, the Yen should be ready to take off and with it the USD/JPY break down badly and with that, the market, THIS IS PRECISELY THE CONCLUSION OR THEORY I HAD BEFORE I PUT TOGETHER THE YEN CHARTS, NOW THEY JUST ADD MORE CREDIBILITY.
Again, does CNBC tell you what really drives the market? No, they tell you the market went up or down because "
insert 2 sentence explanation here" IT'E NEVER THAT SIMPLE AND TRY EXPLAINING THIS TO THE MASSES, BUT THIS IS WHAT COUNTS.
This is the 5 min Yen chart, it too has a negative divergence forming, I believe it has enough time to make a run higher sending the market briefly lower, then make it's pullback sending the market sharply higher creating the last bull trap before the break down-don't forget the long term Leading Indicator divergences,
THIS IS SERIOUS, LIKE 1929.
We see a positive 3C divergence at the lows on the chart accumulated and a run up, the market has moved down at the same time, look at the Yen/SPX correlation above.
This is the Yen tonight, right now it has a 1 min positive divergence, wouldn't it be interesting if indeed the Yen moved higher overnight, we got that market move lower and then switched positions for a sharp move higher. That's just some wishful thinking, but entirely possible.
Finally this is a 5 min chart of the AUID/JPY, a former carry trade with the USD/JPY and EUR/JPY, the AUD and EUR carry trades dies as I followed them for months showing they were falling apart, however the point is, this short term 5 min positive divergence in the AUD/JPY is a risk on divergence and if the pair moves higher, it will support a risk on move up in the market.
Like I said above, recently it seems the Euro and $AUD have come in to play just to help the market effect a short squeeze, they should fade back in to a downtrend, but not before a sharp, powerful move higher sways emotions one last time and we see a Japanese style drop in the US markets.
I could not live with myself if I didn't have short exposure in equities right now, in fact with many of them at partial positions and room to add at better prices, I believe this is the perfect strategic move.
See you in the a.m.