Wednesday, July 27, 2011

Member's Question

I received an email from a newer member tonight more or less wondering what I base my bearishness on. For those of you who have been here for awhile, you remember the MENA situation and the analysis of the long term problems there that are far from resolved. We have watched the EU (PIIGS) fall one after another to the point now where the core is starting to feel the effects of contagion. We've discussed the pitfalls of Quantitative Easing, what I called the "Bernanke Chinese Finger trap" as inflation via commodities shot through the roof and manufacturer's margins were and still are being squeezed. The reports on manufacturing have shown a steady decline in margins and the destruction of the base; in fact manufacturing is nearing recession There are a lot of things that go into my analysis of the market problems which I had called out as mentioned earlier, while pundits were still calling for Dow 20,000 saying, This time it's different". You've seen how thin the market is in my market breadth posts and how QE was used to prop up heavily weighted stocks in the averages while most other stocks fell and caused very thin market breadth. However, I think this chart of the SP-500 (daily) sums it up best.

Green arrows = trend confirmation, the red arrow in 2007 is the market top/negative divergence. We see two others, but what is most telling is the relative price now compared to the 2007 top and the relative position of 3C now, the divergence this time is not just a relative divergence like in 2007, but a negative downside leading divergence, it's the worst I have seen including the Dow in 1929. Don't forget the trend in insider selling which has been unprecedented. Looking at 3C since QE2, I think we have some idea of what QE2 was used for-golden parachutes. What we are looking at is a house of cards.

Internals/Close

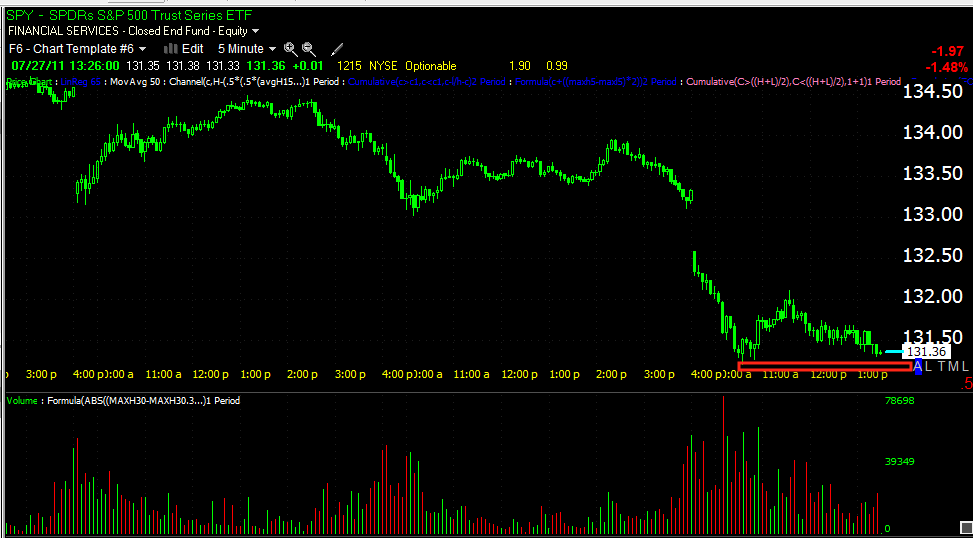
What seemed to be a positive divergence intraday, didn't look so hot at the end of the day. I just heard someone dumped $3.3 Billion in E-mins at the end of day. The market also closed below the 50 m.a. on volume, it is hard to imagine a bounce from here, however we'll have to let the market tell us. Either way, as I've been telling you since last Thursday when I announced I was getting short and Friday as well, any strength in the market should be used to enter short positions that you like and that have minimal risk with good positioning. I've been trying to add as many of these setups as I can and go over the ones you email me.

From the point in June in which we first realized there was to be a market short squeeze (this while the market was still falling) to options expiration when I laid out what to expect for the following week, the theme the entire time has been, "The next shoe to drop will be the most serious". While there are some scattered long trades worth a look, hopefully by now your portfolio has a net short bias with some initial room on your stops and some dry powder.

One of the trades I still like is FSIN, even if you missed our last entry at $7.50 FSIN is still in the zone and one of my favorite trades after making nearly 40% on the last short run.

The ETFs that I have preferred for quick short coverage include SPXU, SQQQ, SDOW, EDZ, FAZ, ERY (added today) and SRS (added today).

Remember though, there are shortfalls to inverse ETFs and advantages to real equity shorts. Read this link for more information.

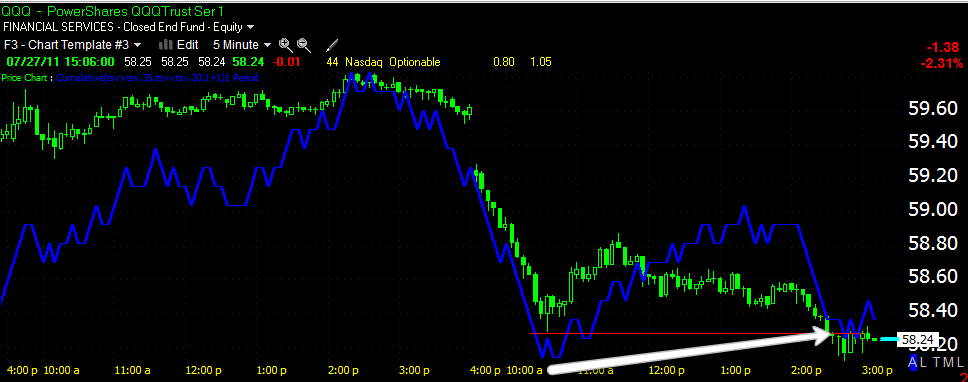
As for today's dominant Price/Volume relationship, it is easily Close Down/Volume up for all of the averages. There's a dual edge to this relationship, it can be a sign of a serious break in the market and it can be a sign of a serious oversold condition.  Since we are so close to the 50-day moving average, we cannot rule out either possibility. The divergences that formed earlier today weren't strong, only on the 1 and 5 min charts with one exception, these are usually little more then a 1-day bounce. However, such an overwhelming P/V relationship in such proximity to the 50-day moving average can set up a nasty bounce up although it doesn't look or feel that way now, we must reman open to the possibility of this happening even if it is remote.

The key thing to remember is how bad the longer term charts look and even if we were to see such a bounce (it would likely be a scary upside bounce with so much selling today), we can't take our eye off the ball and that has been, as mentioned above-since June, the next shoe to drop is going to be very ugly on the downside; just consider the breadth posts I put up a little over a week ago.

Since 2007 when I put out a 5-part video series (before the market fell apart) my opinion has been that we are going to see one of the greatest trading opportunities in our lifetime before this is over. Even if the Fed steps up with QE3, this market is like having nausea and no matter how long you put off the inevitable, eventually you'll have to lean over the toilet and let the poison out of your system before you can recover. I believe by the time that happens, we as individuals will be trading in a secular bear market, something no trader alive has ever traded in equities. I believe the first to adapt and those with an edge will find this to be a very profitable market.

Finally, risk management. I think we have the edge, but an edge is of no use if you lose your portfolio. While we may see some amazing opportunities, swinging for the fences will eventually lead to an ugly end.

My model portfolio which is based on trades taken only after given to you (and honestly I have little time to keep up with it) is ranked #129 of 6759 portfolios.


This week alone it is up 8.16% while the S&P is down 2.98%. I'm happy with that ranking because I know those in the top 50 are making irresponsible trades and they won't remain in the top 50 for long. Sure I could be in the top spot if I put all my money on a single 3x leveraged ETF, but that is not responsible risk management.

Stay focussed on risk, be patient and enter only the trades that come to you and keep in touch with me about questions you may have, I'm here to help you beat the market and learn to beat the market, not just to post updates and trade ideas.

Miners Trading System Signal

Early on when I introduced the Miners Trading System I asked the question, whether it's better to stick purely to the system or whether analysis outside of the system can enhance the results. From the emails I have received, there has been a lot of interest in DUST, even though the system was technically long NUGT. I think I've put out probably 10 updates relating to DUSt and how strong it has looked and I know at least 10 members using the system have stayed in DUST based on the independent analysis.

I think we've answered the question definitively.

This post is from Monday night's signal

Despite the system signal, I couldn't ignore the strength DUST has been showing for the last week. For the members who went with analysis over signal, congratulations, you just made 6% in a day!


As for tonight's signal,
System 1 clearly crossed to a DUST long, system 2 is right there. This would suggest to me that DUST has plenty more upside.

Here are the updated charts for DUST today.

 Hourly in a leading positive divergence

 30 min-an incredible leading divergence that looks like DUST was accumulated even as it moved higher.

 The 15 min chart is just as amazing.

On the 5 min there's a slight negative, this may lead to a little weakness tomorrow which would be perfect for anyone who is not in DUST to enter the trade. By the looks of the 60 min chart, DUST should have plenty of upside.

Perspective part 2

I should have included these longer term charts in my last post as to why I've been short since last Thursday and why I'd use any strength to short in to.

 DIA

 DIA

 QQQ

 QQQ

 SPY

SPY

Perspective

I'd still be using any strength to initiate and add to shorts.

JUST LOOK AT THE SELLING THAT OCCURRED

 The white arrow is around the time the averages broke support, the NYSE TICK data hit sub-1500 readings, that almost never happens. Talk about a shakeout.

I'd look for them to target the 50-day moving average as seen here.

Market Update

In my last market update covering the SPY I said,

"I'd keep an eye on this... remember accumulation is generally in flat zones."
and after showing this chart...


"Support area, although it could certainly break that to surge volume on a head fake."


Well, that's what appears to have happened, exactly...
 DIA break of intraday support, volume surges, a perfect head fake set up for a bounce. The break down is obvious to all technical traders, they're going to short it, when prices move up, they're squeezed and add to the buying pressure when they cover.

 This is a relative positive divergence, measured between two relative price points, the second being lower then the first, but 3C is at least even if not slightly higher (5 min )

 Here we see the same support in the Q's broken for the same reason.

 and a 5 min relative positive divergence. If 3C was confirming the trend, it would have moved lower.

 And here it is in the SPY, causing volume to surge.

 The 5 min divergence here is stronger and in leading position.

We even have a 10 min positive divergence.


I believe the same thing is even happening in MCD as I warned in the MCD post.


All in all these are not huge divergences, but they have lasted most of the day. I think they have the capability of lifting the market.

Trade Idea-ERY (Long)

Honestly, USO hasn't shown much clarity whatsoever, except for the longer term charts. I have maintained my view that USO would pullback, likely be accumulated and then make a real breakout through the flag, something it has failed to do. In the meantime, ERY has much more clarity then USO (inverse 3x leveraged short on Energy). I like the idea of a reasonable size position in ERY for at least a swing trade and then we'll see what happens from there.


 We've seen these false breakdown all too often before a reversal, they always target a well defined area that technical traders will identify with.

 3C hourly on the breakdown below support suggests the move was a shakeout/head fake

 As does the 30 min.

Since the hourly Trend Channel has worked well with swing moves, I'd consider using it as a trailing stop.

MCD short trade follow up

We took out a short trade on MCD on 7/22 based on this post

Here are the charts...
 This short was after MCD's earnings pop and at the red arrow.

 The daily chart looks bad so I think MCD will start topping soon, which is usually a volatile affair.

 The hourly chart was telling us there would likely be selling into the gap up, which there has been.

 The 15 min chart helped us time the entry.

 However, as you can see now there's a bullish descending wedge, that looks ready to make an upside move, we may see a downside head fake first.

 The 15 min chart recently is positive, combined with the wedge, I think up is the short term path of least resistance.

The 5 min chart shows the move is close.

Personally I'd take the small profit here and re-establish the short at higher levels. The disposition of the longer term charts look like MCD has reached a top, but with these signals, that doesn't mean we can't see some counter trend volatility to the upside.


Let me know if you like these smaller charts better. Remember you can always click on the chart for an enlarged view.

Trade Idea-SRS (long)

Is SRS finally going to catch a break?

This has been theoretically one of my favorite trades considering the real estate market, but it just hasn't caught an updraft, that may be changing.
 On the daily chart, there's a huge bullish descending wedge, volume s correct for the pattern.

 The daily chart has also shown a significant positive divergence, especially recently.

 Here the hourly chart confirms the recent positive divergence.

 The more detailed 15 min chart shows a turn down from the range highs on distribution and a positive divergence in SRS.

Here's the first hurdle-resistance near $14.20. Note the swing trend classification of the last 3 days making higher highs/higher lows and today a 3.4% advance on increasing volume. If SRS can break out finally, the long term price pattern implied target is anywhere between $30 and as high as $60+

As a swing stop, you might consider the 60 min Trend Channel which has held all of the swing trends in SRS. The stop would be in the area of $13.60-that's not bad risk/reward. If SRS can perform, we'll have to widen the stop.

Treasuries/TLT Update

Lets not forget TLT which looked a lot like GLD yesterday, here was the short term call from yesterday...
TLT's Intraday Action

Here was the short term TLT chart from yesterday's post...

And today's reaction...
 Today's intraday fall from yesterday's intraday bearish call on TLT.

 On this 30 min chart I had warned previously twice about pullbacks from the two areas at the white boxes.

Intraday, it looks like TLT wants to bounce. The long term charts remain muddy, most probably a result of the ongoing drama in Washington.

SPY pullback

I'd keep an eye on this... remember accumulation is generally in flat zones.

 Support area, although it could certainly break that to surge volume on a head fake.

 5 mn 3C

10 min 3C-

the longer the divergence goes on and the longer timeframes it hits, the bigger the eventual move will be. Right now it's looking like it's setting up for an intraday bounce.

Market Update

It looks like an intraday bounce is coming.

 DIA 5 min positive

 QQQ 5 min positive

SPY 10 min positive