Tuesday, January 4, 2011

Part one OF Trends for 2011

I'll be covering some of the opportunities that I'm seeing arise, hopefully they'll be somewhat secular in nature.

One of the first is the Fed's plan to buy treasuries on the long end of the curve that can be found in the Fed minuted I posted today from the December 14th meeting.

TMV is an ETF that is bearish on the 20 year, last year we had a decent trade there by buying TMV, it seems that trend may be about to reverse. They said they plan to buy throughout 2011. On tonight's new January Trade List this trend is reflected in the trade, TMF.

I like TMF right here and now, although it's prudent to manage risk.

Here's the chart...
First we see a positive trend in MACD, I use a long version so it cuts out noise and reveals the trend, it is certainly turned positive. Next we have a high volume event that is indicative of a type of capitulation-meaning sellers gathered steam and all sold on that day en masse. Finally in the white box, we see TMF breaking out of the trading channel.

Next on this 15 minute chart, intraday resistance over the last several days is marked by the red trend line, as you can see, TMF is very close to breaking out of that resistance.

10 minute 3C chart. As you can see, today saw a very positive divergence, it looks like a head of steam is building towards a breakout. You could use a limit order, but I personally would have no problem entering this trade in the morning at market.

The 5 minute chart looks just as bullish.

Remember, this is a 3X leveraged bull ETF on 20 year treasuries. ETFs do have some limitations, but this seems to be a fairly good way to play this trend. I believe this could end up being a longer term trending trade, which is my favorite kind. However, it requires that you have a sufficiently wide stop, there will be ups and downs, the overall trend is what we need to be concerned with, not the intraday or even daily gyrations that are found in any trend.

Other 2011 trends that seem to be emerging that will be covered this week include European banks which could be facing a lot of trouble in 2011. US housing and related service industries are another theme. Certain financials will probably develop as the foreclosure crisis takes shape. Certain FX/currency markets are offering some opportunities. Precious metals is unfolding now at a make or break point and there are a lot more. The trade list as well as featured trades will reflect these themes and we'll be looking for the best low risk/high probability setups. I suggest setting alerts on the limit trades, not actual orders. We don't want to show the market our cards ever, including stops. FreeStockCharts.com will allow you to set alerts and use realtime intraday feeds without the 20 minute exchange imposed delay and it's free.

As for the market today, Monday was strong, today was mediocre like we saw late December. As I mentioned last night, the Price volume relationship seemed to be indicating a one day overbought condition and I believe that's why we did not see follow through buying today.

Today the price volume relationship was more moderated with the theme being close down and mixed between volume up and volume down.

Here's what the closing 3C charts looked like

 The DIA ended with 3C roughly inline.

 The Q's looked the worst with a negative divergence
 The SPY looked the best as it was perfectly in line with price.

From the charts above it's difficult to say which way we'll open. There's been weakness thus far overseas so that may filter into the US market but it is more likely a reaction to the lack of upside follow through in the US markets.

Tomorrow I'll continue adding trades. With good risk management, (as per the risk management link) you shouldn't be too bothered with pulling the trigger on trades that trigger. A few subscribers did excellent with PEIX today, but they had to pull the trigger. Good risk management should put you in a position in which any losing trade shouldn't cost you more then 1-2% of portfolio value at the most (although we can't account for surprise gaps other then not investing more then 15% in any one position). In reality you can have a majority of losing trades and still make very positive returns with good risk management.

There were many informative posts today about where the market is at, if you missed them, please take some time and go back to read them.

It's also getting to be about that time in which we take a look at market breadth again, so perhaps tomorrow or tomorrow night we'll take a closer look at the market's internals.

 I'll be adding more trades tomorrow, for tonight, TMF is my favored long trade.

PEIX

PEIX is one of our cats and dogs trades from December 20th, today it's showing quite a gain. The strength of the close and the volume normally will bring about a follow through day of buying.

Precious Metals

Sentiment is a funny thing, so are the words that accompany extremes in sentiment, "This time it's different".

I'm not going to pretend I'm a PM expert, I'm just going to show you what the market has to say.

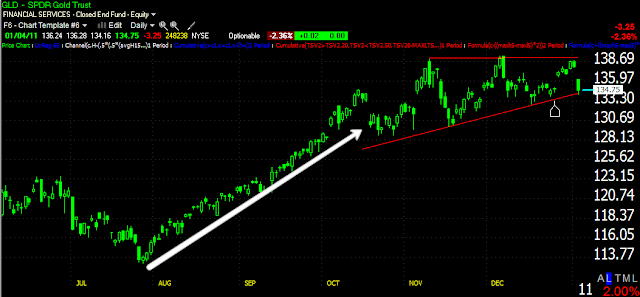
 GLD 60 minute 3C chart.  You can argue against opinions and such, but there's no arguing with the fact that every time GLD has hit resistance, a negative 3C divergence has met it sending the metal lower.

 Note the very straight trend in GLD, almost looks like program trading ramping it up higher with virtually no pullbacks. Next around November we enter a volatile stage and meet resistance just as gold is hyped everywhere. It seems there's not a person who is bearish on gold. Yet, today GLD sits at the support that has held for nearly 3 months. A break of this support could be a very big and potentially profitable event. Price gets to make the final call, but GLD has certainly seen deterioration in the trend.

 Here we se SLV and the negative divergences around $30-the line in the sand.

 SLV has entered its own bit of volatility, contrast this chart with the one below and take note of support and where SLV sits today.

The white arrow shows another strangely bullish, orderly market, until November when volatility is introduced. These trendline/support areas are going to be important to watch moving forward.

Just Read the FOMC Minutes

I just read the entire publication, interestingly, there are some seeming contradictions there, especially as it pertains to the labor market. It read more like a partly cloudy weather forecast, if it rains you're right, if it doesn't you're right. 


There were quite a few upbeat assesments of the labor market in certain areas, but they were contrasted with the uptick in unemployment from 9.6% to 9.8%. I find it utterly and disgustingly disturbing that it's not just the headline media that continues to ignore the "U6" employment data, which is the broadest measure of real employment as it pertains to real Americans and their situation. Not only does the media ignore this number which is nearly double the U3 headline rate, but the Fed ignores it as well.


There was a statement that I found interesting, although not surprising. The Fed's POMO in which they monetize debt from Primary Dealers leaving the Primary dealers with abundant cash as they sell debt at a profit to the Fed. These Primary dealers have been said to use that money (most likely at the Fed's direction-after all, they are profiting from selling treasuries back to the Fed) to ramp up the stock market. 


In my posts and analysis on breadth readings, the market's total breadth has fallen drastically while the headline averages head higher, translation-fewer stocks are participating in the rally and the PD's can ramp the market simply by buying the most heavily weighted stocks in an index. For a rough example, if the PD's buy AAPL and it's up 1.5% for the day, the 51 least weighted stocks in the NASDAQ 100 can decline by an average of 1% and the NASDAQ 100 will still close up higher for the day due to index weighting.


The Fed all but flatly admitted this in this staement, 


"Household net worth rose further in the third quarter, as an increase in equity values more than offset the effect of a drop in house prices."


Furthermore, I don't even believe it's true! There's barely any retail left in the market, we've had months upon months of withdrawals by retail (consecutively I might add) from domestic equity funds. So participation by retail investors has to be near the lowest point in history, yet those who own houses are experiencing a double dip recession in prices. Even if retail was in the market at a 5 year average, which they are not, their houses are their biggest investment by far. Lets assume you have a $200,000 house and it has declined in 2010 by 10%, that's a $20,000 net loss. The average person who owns a $200,000 house may have $5-$20,000 in the market at most I'd guess and the high-end of that is pretty generous.  The S&P saw an 11.88% change-again we assume that investors caught the entire move-that leaves them with a net return of $594 to $2,376. The middle class is by far the biggest class and probably being hit the hardest with declining housing values as credit for most buyers in this segment is near impossible to come by. How this statement can be true or even close to true is mind-boggling. And where the data comes from , I don't trust it for a minute. We live in Florida, a pretty affluent area with high demand. It's said that real estate has lost about a 1/3 the last 3 years. I know from experience in a wide range of housing prices, that most people who appraised and took out Helocs or refinanced have lost something more like 50-60%. In looking at real estate recently as we were buyers and talking to all kinds of owners, people who even bought before the boom, most of them are underwater around the same amount. For example, a condo that sold for $145k in 2005 is now sitting for sale for 6 months along with 3 others and they can't get $79k asking for it. Friends who took out HELOCS with appraisals at $450k are seeing homes in their area sell for $160-$175k. 


Add to that the severe underperformance of most funds during 2010-as most people don't manage their own money, the stats become even worse. I know there's a lot of hypotheticals in there, but a I said, it's a rough example. It seems this part of the minutes may have been an attempt to justify what the Fed has been doing-it was very prevalent in QE 1, not so much in QE2 and the returns since QE2 will show that.


In any case, the market's reaction? At first, muted. We just saw a quick burst and here's what we have now...


SPY drifting lower after the Fed release, around 3 p.m. a ramp up and a negative divergence that has thus far reversed the ramp up.


In any case, I have some new perspectives on 2011. The January trade list is up now, it's just starting to be populated. I'll cover themes later tonight.

Here's the Minutes

Federal Reserve Minutes December 14, 2010

Market Update

The Fed minutes should be released any minute now. Here's a snapshot of the intraday market.

 QQQQ 1 min. The white is a positive divergence and the red a negative divergence. Either someone is in the know here or we're seeing some hesitation to take prices any higher on this intraday bounce with the Fed minutes due out.

The SPY had no positive divergence, there is a 1 min negative though.

XLF/Financials

Yesterday we saw an unusual leap in financial stocks, mainly Money Center names like Bank of America, as such XLF broke out to the upside.

This morning we have some news from Bloomberg that probably was the cause of that pop. It seems a settlement is underway in the fraud committed by these banks in all things having to do with foreclosure-YES we are behind the information curve and yesterday that news was being discounted by way of higher prices. It's cynical, but there are two realities, Fraudclosure-gate was (and still could be) likely to be the second shoe to drop in the banking sector. The second and more cynical reality is that if you are connected to Washington by the purse strings, you can count on favors. That's our America, one set of rules for them and another for us.

Still, XLF is acting a bit strangely today. The banks are down a bit, but Financials more broadly are taking it on the chin.

 XLF thus far looking like a bearish engulfing pattern today-(daily chart)

And here's the 3C 1 minute chart from yesterday and today. Note yesterday looks much like the SPY post I just put up, except the gap u[p this morning in XLF, it saw a strong negative divergence right off the open and XLF has traded lower since.

I'm going to take a look at the financial sector, the money center banks don't seem like they ar responsible for the depth of the decline alone, so there may be some opportunity lurking out there in a related financial sector.

New Year Trade Themes

Later I'm going to be posting some of the emerging themes I see developing and the trades that go along with them. Some interesting things are certainly afoot. Looking at the SPY today however, there's a bit of a mystery.

 SPY 3C 1 minute chart.Ysterday I showed you the negative divergence that set in the SPT and market in general, as you see above, that was the high of the day for the SPY. Thus far this morning 3C is confirming the weakness in the market. This could be unwinding of risk before the Fed's minutes released at 2:00 today, or something else.

 Here's a more important hourly chart of the SPY. There was a negative divergence through December which made sense, after all, for practical purposes, the SPY was nearly rangebound. The last 15 trading days or 3 weeks netted a total return of 1.48% which works out to be about a tenth of a percent a day, which is in my opinion a flat market as a strong move could easily do 1.5% in a day-this was 15 days so the distribution we see made sense.

Looking at the same important hourly 3C chart, what doesn't make sense is yesterday and today. Look at the scope of the negative divergence at yesterday's highs and the leading divergence we see today marching lower. This could be very significant. I've posted a number of charts today and yesterday showing what happens when a breakout fails, it isn't pretty. Perhaps the Fed minutes will provide some clarity, but this is a very deep change in character over a day.

As I mentioned, there are several macro-economic themes that seem to be taking shape and I believe they will offer some nice trending trades which I prefer as a good % gain can be made. Look for that tonight, I may post a few ideas during market hours, but I want to address the themes tonight in the wrap up.

LNG Update

LNG Triggered December 30 at $5.89, it's now up 6% and as high as 13% yesterday. LNG may have some more to offer, but anything over double digits, I'd consider locking in some gains.


Being LNG is not a Cats and Dog Trade, you may want to let it run a little with a tight stop as it does have an initial target of nearly $8.00 based on the triangle. You can find this on the December 27th Trade List.

USO Follow Up

Here are yesterday's and this morning's comments on USO

Yesterday's warning of a negative divergence forming


Another False Breakout from yesterday   "USO could tumble pretty hard in a short period of time."
 This morning


This is a parabolic price move. Look at the sell side volume on the way down.


Yesterday I was able to identify the negative divergence using 5 min charts, this is a 60 min chart and the red arrows show negative divergences/distribution with a failure at each. Note the very negative divergence as USO tried to hold above $39 on a false breakout. Once again, false move, reverse fast and hard, thus the parabolic nature of the price move.


SLV UPDATE

Yesterday was another failed test for SLV holding the line in the sand at $30, some of you may have chosen to trade SLV for a quick move, after all, failed moves or false breakouts can turn around pretty fast in the other direction and that's what we are seeing this morning in SLV.

Here are yesterday's posts on SLV and the deteriorating condition.

Post 1
Post 2
Post 3


As you can see the level of $30 that we have identified as the line in the sand is the correct level. One it's shown good resistance and solid fights at that level and two the human mind gravitates toward whole numbers so $30 is a natural area for people to place importance on. As always, please remember that support and resistance are AREAS not EXACT Numbers, many technicians fail to understand what creates support and resistance, it's the same as what moves the market, FEAR and GREED and neither care about an exact number, this is why we see moves above $30 that fail or moves fail at $29.99 or $29.85, still the area is $30 and this morning we have confirmation that the Silver vigilantes trying to take down JPM's short are now selling at a loss after buying above $30.

5 min 3C chart showing a negative divergence at the failed breakout from the triangle, tis is just before I posted link #1, the failed breakout is link #2. In the white box you can see an attempt to cling to support at the end of the day, it failed and we are now seeing a pretty good move down as those who bought yesterday are selling at a loss-fight another day I guess.

SLV is a long trade I believe can work, but as I have maintained, it NEEDS to hold $30 and it hasn't been able to do that.

UQM

Keep an eye on this C&D trade, it just triggered an alert and resistance is at $2.48

Other Trades from Yesterday

AMP closed strongly, this one triggered early in the morning yesterday and the close was on increasing volume.


AMP Daily

Here's a Swing Trade Stop using my Trend Channel, just make sure that you don't give up any gains for a loss on this one. As/if it moves higher, the Trend Channel will continue to move up and lock in gains. Email me for the latest stop whenever you like.

SIRI also triggered early yesterday and today has some follow through gains

 SIRI Swing Trade Stop
SIRI yesterday/today

If you want the trending stop, email me, right now though I'd say lets start with a Swing Trade and see how it develops.

GOK also triggered yesterday, watch price and your entry, if it moves up from here, I'll post a Swing stop or you can email me as usual. The same goes for NLS which also triggered early yesterday morning.

RPC is doing great, just remember not to get greedy-it is a C&D trade

RPC has offered gains intraday as high as 48% in less then a day.
TThis is a very tight stop, you may wish to adjust it.

Sprint (S)

Sprint is up about 5% since the trigger yesterday, this is a trade that really can't be called a "Cats and Dogs" trade and it closed strongly yesterday on good volume which set up a follow through day today. If today closes strongly and volume rises again, there may be more to go on this leg. This is a trade that could become one of the trending trades or at least a swing trade. The first pullback should be to the 10-day moving average.

So far, we have confirmation in every timeframe on S. Anyone in the trade, email me if you need the current situation or outlook on Sprint's breakout from the consolidation triangle. IT was a very clean breakout which bodes well for S.

Early Update

You know I don't like relying on early morning forecasts, but as I said and showed you in last night's post, the Q's were the strongest, they remain so this morning, but there's some negative divergences right off the opening move.


Also recall last night the Price Volume relationship and the possibility it hit a 1-day oversold condition.

 DIA

QQQQ

You can see the positive divergence from yesterday in the Q's, and the negative divergences this morning in the SPY and the DIA, this is exactly what  3C was signaling last night, the NASDAQ would outperform in the early going.

SUTR

Another Cats and Dogs trade that's breaking resistance at $2.30, you don't want this to close or any of them to close below their breakout levels and most of all, try never to let a profit go with these trades.

USO update

USO is a trade I've been a bit bearish on and yesterday it went up with the market, today it's back below support. I like it in this area with a stop above $39.00 maybe $39.17 or something like that, the more room you give it, the better chance it will work out.

A Few More Cats and Dogs

PSID just triggered, but I only like this one above .72 (long trade)

MVIS has broken resistance at @ $2.02

BQI if it can get above $.44 it may be worth a shot

AEN also triggered, breaking out above resistance.

At this point any 1-day double digit gains I would consider locking in a good portion if not all of the profits, depending on your risk management and tolerance.

PEIX

For those of you who traded PEAIX, it's broken out this a.m. There's still a trade there, but you need to be able to watch it and really tighten up the risk management

Daily Wrap

Well insider transactions were released today and it's the same as it has ever been at least for the majority of 2010. Insiders were heavily skewed toward the sell side. We saw a smaller ratio this week then in previous weeks and months, nearly 19 shares sold for every 1 bought, in dollar terms that comes to $4.3 million in buys and $81 million in sales for the week, not as high as the 5 digit to 1 ratio we have seen, but still selling.
This is not a spotty trend, it has been consecutive for months and unrelenting and as I've said before, there's lot of reasons insiders may sell, but “I believe my company's stock is going higher” is not one of them.
Until last week for the first time in seven months, the same was true of domestic equity fund flows, retail had been taking money out of the market every week for 7 consecutive months until last week we saw the first inflow, 1 week a trend does not make. However, when we look at the overwhelmingly bullish sentiment, it makes sense that retail is dipping its toes back in the water, just remember that when the market trades at extremes, we are generally close to a change in sentiment. We also got data today from Smithers and Co. that finds the S&P to be 70% overvalued. I'm not following the actual input that have allowed them to reach this conclussion, but if you look at the S&P pricing now, vs. the S&P pricing around early 2006 (at comprable levels) the market was in a lot different place then it is now. Back then we were still in the midst of a consumer led bull market rally based on homeowners spending like drunken pirates based on rising home valuations, the market was still in a place in which growth was attainable, even though we'd soon pay dearly. Now we are pretty far from growth with unemployment clinging to stubbornly high levels, consumers not spending and a whole cornucopia of negative events taking shape including fraudclosure, the wholsale buying of US debt by the Fed as no one else is interested or trusts the US to make good on its debt obligations, record levels of banks closing their doors in 2010, pension fund unfunded liabilities, municipal bond selling on a huge scale, so on and so forth. The fact is simple, back then we were still looking forward, now we are stuck in an economic hole and those on Capital Hill won't stop digging. So overvalued? I buy it, but the market has always been and always will be the perpetual pendulum that swings way too far one way and then way to far the other with only a brief amount of time spent at the median.

As I mentioned last night, it was likely we'd see gains in the market today. Window dressing by institutional money “The Art of Looking Smart” is often found at quarter and year end, it's a time when they offload underperforming assets so they won't show up on the next quarter's prospectus. After the quarter's end, many of those companies sold are added back to the portfolio and judging by the market action today, it looks like that's exactly what happened. It may take a few days for the market to start acting normally, meaning for the second part of window dressing to be complete. So right now is a good time to take the market's temperature so to speak; to uncover the early 2011 trends taking shape in institutional allocation.

Silver has been an ongoing battle, I'm indifferent to a long trade in Silver, I have nothing against it, I just don't know that the real facts of the Silver/JPM vigilantes, vs the JPM Silver short are truly out and in the open. The one observable fact has been SLV has seen several battles at a line in the sand around $30. It looked like overnight that line had been decisively crossed with silver over $31. SLV, however told a story today that the battle still rages. See my earlier posts today on Silver and the obvious distribution/negativedivergences that sent SLV packing from a plus $30 level to a close of $29.99

Remember the earlier article in which I said the triangle looked like the $30 level would be tested, and how'd we know that?
Above you can see the false breakout from the triangle was met with several 3C negative divergences that played out exactly as we'd expect. A pretty volatile decline on big volume. Silver will be on the radar.

As will housing. I'm bearish on housing, now it's time to find the trade setups. I just went through the process of house hunting and what we saw out there was ugly. Agents are literally walking over each other and they don't care who you're working with, there was a time when they did and wouldn't waste their time, not anymore. Short Sales... no one wants to touch them. 80% of first time bids on short sales, the buyer walks away due to the process taking so long not to mention the banks deciding to just halt them and then restart them and most everything out there is a short sale or a bank REO.
Housing will certainly be a 2011 theme that should produce some lucrative trades. You've seen the recent data, it's not getting better, we are in a double dip recession in housing prices which leads to a lot of other worm holes.
As for today's market's Price Volume relationship, I bet you can guess...
The market finally closed above 1% for the first time in over two trading weeks, so the winner is..... Close up and Volume up by a wide margin. On the Dow we had 25 that fell into that category-this is the most bullish price/volume relationship of the four. The NASDAQ 100 had 86 and the Russell 2k had nearly 1400-the S&P had 400. Sounds pretty bullish right? Except this, when we see such an overwhelming dominance in the P/V relationship, it can often signal a one day overbought condition and as I showed in the last post, we had many stocks that took very bullish gaps and turned them into very bearish closing reversal candles.

As of now Asia is in the green and futures are higher, however, as we saw with silver and names like INTC today, things can change in a hurry and Asia (other then on Mondays) is usually a lagging indicator following what the US did the day before.

At 12:52 today I posted the first market update showing a change in character in 3C, here's what it looked like.
As you can see, 3C had already gone into negative divergences before the market hit its highs earlier in the day, the negative divergences in 3C cut off any further gains and it was time to give some back from there through the close.

Interestingly, the 5 min 3C chart hit the highs right on the head and look at the leading divergence from there to the downside in 3C. It's no wonder that was the peak in the market and many stocks gave back almost everything they gained from their gaps on.

The NASDAQ (QQQQ) did end the day with a nice looking positive divergence though so I'd expect, barring any unforseen surprises, the Q's should see a strong early morning. The Dow didn't look quite as good on the close but not horrible, the SPY was inline so it looked the worst. Perhaps we'll see some strength in tech in the early going.

XLF had a strong day, it'll definitely be on the radar tomorrow.

However as I pointed out in today's intraday trade, several market bellwhethers are falling apart-MCD and INTC were two I covered. We'll be watching more of the bellwhethers as some of the cats and dogs trades seem to be winding down, it's time to watch for weakness in bellwhether stocks and probably tomorrow I'll cover market breadth, it seems like a good time to do so.

Now that volume has returned, we should be able to pick up a few good trending trades, look for an updated, new January trade list tomorrow, but don't miss the featured trades I chart out in the posts, bookmark them if you have to, right now, it seems like it's turning into swing trading season as soon as window dressing-”the aftermath” is complete.
One final note, Friday I set a bunch of Cats and Dogs trade alerts, many of those triggered today. As you know since I downloaded the beta version of TC2000 (one of the perks of being an affiliate) I had a system crash that wasn't resolved until mid-morning today, so those trades weren't put on a list, I just called them out as they triggered. I think they can still be played, but if you entered any, please email me for the current outlook, stops and targets. It's easier to do that then to list 100 + trades that may not be worth playing much longer as the January list will be looking at swing trades that I'm running scans on tonight.