Tuesday, September 23, 2014

Daily Wrap

Today, despite whatever happened on price downside or later 3C positive divergences, although not as strong as I'd hope to see by the close, the two most important aspects for the week are the same two highlighted in red last night in the Daily Wrap from the last paragraph of last Friday's Daily Wrap, that would be...

""Finally, as I said in the week ahead forecast, I think early Monday we'll see some weakness, perhaps in to a bounce later in the day and maybe in to Tuesday, I expect HYG to decline from there as it has already started falling apart. If the 3C charts don't put together an intraday positive after Monday morning, the market will be in big trouble fast, however based on breadth like the S&P and Morningstar sectors, I'd expect at least 1 day of correction to allow them to try to work off some of that oversold tension, but oversold can quickly turn in to bear material, that's how this market will end.

Have a great weekend."


And more specifically...

"If the 3C charts don't put together an intraday positive after Monday morning, the market will be in big trouble fast...

oversold can quickly turn in to bear material, that's how this market will end."

Specifically today, all 4 major averages are now below their F_O_M_C Knee-jerk move from last week as the Dow loses all of its gains today on a -.68% decline,  this is the concept of the F_E_D / F_O_M_C knee jerk reaction and how it's almost always wrong.

The Russell 2000 added to its July highs loss now at -7.5% and its year to date loss of -3%.

Interestingly, some of the financial sites are now picking up on the elevated SKEW we have pointed out since Friday, which started Wednesday after the F_O_M_C. Friday's SKEW reading was the highest in almost 16 years, just 1 month shy (15 years 11 months), so there's definitely something to the smart money bid for deep out of the money puts that can only be worth something if the market essentially crashes, thus the SKEW is often called the "Black Swan Index". 

I had to dig deep today to find hints of expectations in the near term as they dictate what we'll do with the rest of the week, but those two sentences from Friday's Daily Wrap are the KEY to this market and just how bad off we are.

I looked at ES/VWAP, the area market makers and specialists try to fill an order to sell or buy for an institutional client in stocks they make a market in, in this case sell as institutions use the Volume Weighted Average Price as a report card on the effectiveness of the fill the specialist (NYSE) or market maker (NASDAQ) end up filling their order. Today looked desperate which has me a little on the fence regarding yesterday's divergence and today's possible head fake move to set the divegrence in motion. This is what we forecast on Friday in the week ahead and the Daily Wrap, front end of the week bounce based on a deep (now much deeper) oversold breadth condition which means oversold market of stocks while the stock market's facade hides the deterioration below the thin veneer. If I have to call one or the other reality, the number of stocks in decline vs new all time (recent ) highs in the market is much stronger evidence of the overall market's position which I think I have been appropriately comparing to a ginger bread house.

Today's VWAP action in ES looked more like desperate selling than accumulation or a head fake move off yesterday's divergences,  this is why the sentence from Friday is so important..."

"If the 3C charts don't put together an intraday positive after Monday morning, the market will be in big trouble fast..."

VWAP applied to ES/SPX Futures today...
 During the cash market there were 4 attempts to hit WVAP, the sell area for middle men, the last 3 failed before price broke below VWAP's lower standard deviation. This  has a distinctly different feel than the possible 1-day divegrence and head fake move just before it launches...

Since HYG failed so miserably today as expected Friday, it seems the USD/JPY was the only support and that failed just after the European close with ES ([purple) dislocating to the downside something fierce.

Speaking of HYG, it was not without its gravitational pull as HYG has been forecasted to lead the market lower just as it has led every stage over the last 2 months.
 HYG (blue) vs SPX (green ) intraday today

And HYG vs SPX for the entire August cycle in which it led by 4-7 days.

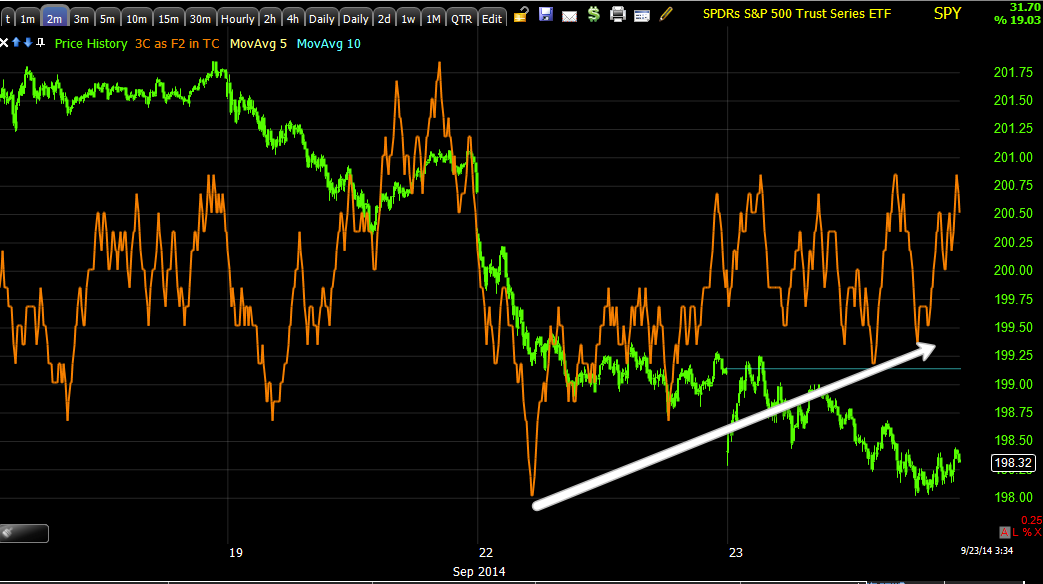
After the close, the SPX broke its 5-day moving average, I'd expect that as a head fake move during regular hours as it would be very effective, maybe it will have some effect tomorrow on the open, but here's what happened shortly after the close.
The red arrow points to the after hours bid/ask (blue hash marks) and the SPY broke below its 50-day moving average.

Another interesting correlation today was yields, we know they tend to act as a magnet which is why we have long used them as a leading indicator, for instance 5 year yields as a leading indicator...
 The 5 year yield tends to pull the marke toward it and acts as a good divergence indicator as seen above, the SPX in green nearly perfectly in line with Yields.

Interestingly today, the market could not escape the pull of 30 year yields as we recently posted TLT's pullback is over...
30 year yields in blue today vs the SPX, each stab at VWAP seemed to be pulled down by yields making TLT's 3C charts of interest.


TLT's shorter term probabilities still favor a minor pullback, but as far as the pullback from August 26th (when we posted the signals of it), that pullback appears to be complete and higher prices look to be in TLT's futures, thus any short term pullback would make a nice entry and judging by the action in 30 y yields vs the SPX, maybe a necessity for the market to bounce at all even for a day.

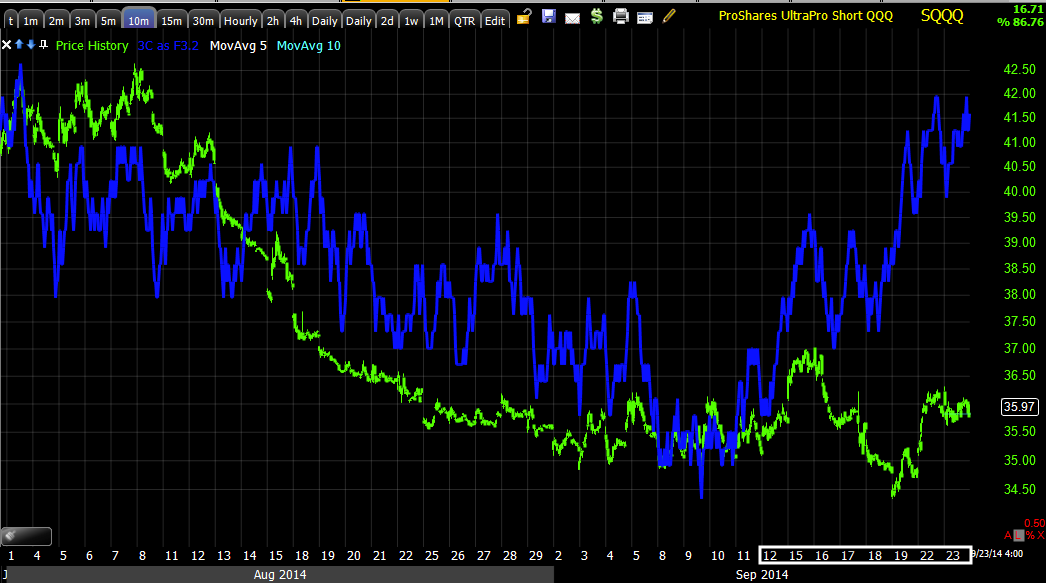
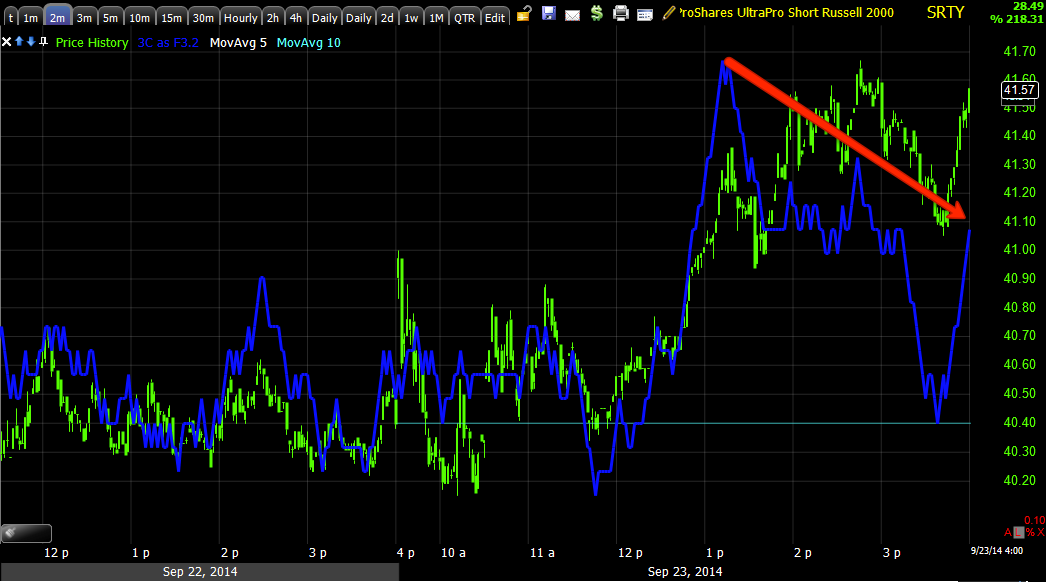
The leading indicators signaling a positive divegrence/head fake move today were largely in Professional sentiment, let me emphasize that these are weak, short term signals only, the larger trend signals are also provided and that gives you more evidence of the massive market failure we're expecting, actually already in if you are in one of the 47% of NASDAQ composite stocks already in a bear market or 1 of the 40% of Russell 200 stocks in a bear market or even RUT short as my SRTY long keeps moving my portfolio's equity line higher and higher every day.

 Intraday, both professional sentiment indicators diverged positively and they are pretty good with near term moves, this is the first vs SPX today...

 This is the second one today.

However as mentioned, as just another piece of the puzzle for the primary trend's resolution to the downside, look at their longer term signals in the August rally which was all based on oversold breadth...
 The first is leading negative like HYG.

As is the second and you can see how effective they were in leading and confirming the market in the earlier stages of the August cycle.

So while it's VERY borderline, we have several short term indications that the early week divegrence and bounce can still get off the ground, although intraday trade such as ES/VWAP looks pretty darn bad.

I dug extra deep in breadth indicators today to try to get a feel. Normally at any other time over the past 10 years or more, these indications would lead to a next day bounce, this is what I've feared for the market itself (good for me and most of you), as I wrote Friday, the second sentence...

"oversold can quickly turn in to bear material, that's how this market will end."

Since we are not up against Quad witching like yesterday, today's Dominant Price/Volume Relationship is of more use, however it was a dual dominance, but still oversold. 16 of 30 Dow stocks were Close Down/Volume Down, like I said yesterday as this was the dominant theme, I call it "Carry on" and that's what the market did today. However the second place theme was Price Down/Volume Up, it's still bearish as price is down, but the volume up usually signals a short term mini capitulation event or bottom short term, there were 13 stocks oin this DOW category.

The same is true for all the other averages, the dual dominant relationship will show  Close Down/Volume Down first and second, Close Down and Volume Up (both close down though showing extreme weakness in the market). The relationships in the other averages goes as follows keeping in mind which theme . For the NDX, 42 to 37; the  R2K 735 vs 784 , The SPX 206 vs 125.

although not a singular dominant theme as I usually look for, the oversold breadth is obvious, it's just a matter if it works like it has for over a decade or if something is really broke in the market as warned Friday (in red)...

I decided to look at more of my scans to get a better feel, I found of my DeMark buy and sell signals, the buys were 146 and sells only 17, this leans toward short term oversold and a bounce. 

The S&P sectors saw 9 of 9 red for a second day, extremely oversold, but yesterday should have produced a bounce today, if we don't see something tomorrow, I fear that warning above in red may be reality. On a 5 day basis, 8 of 9 are red for the week, materials leading, Energy lagging. On a 2 week basis, 2 of 9 are green, 6 of 9 red with Financials leading and Energy lagging and on a 21 day basis (still in our stage 3 top for the August cycle), 6 of 9 are red with health care leading and Energy lagging.


Amazingly like yesterday's absolute dominance of sellers, of the 239 Morningstar groups, 215 of 239 were red, almost the entire market across the board. On a 5-day basis, 216 of 239 are red.

Interestingly, considering how bad breadth deteriorated yesterday, several of the indicators posted made almost no move today which would be bullish considering market action. The New High/New Low Ratios for multiple periods (in terms of weeks) barely budged today whereas yesterday they saw huge deterioration. Apparently there weren't a great number of multi-week new high/lows, however as that breadth indication saw some neutrality which can only be bullish in this market, others saw continuing deterioration like the Advance/Decline lines, take the NASDAQ Composite's for instance..
NASDAQ Composite (all NASDAQ stocks) saw the A/D decline deteriorate even more...

And the Percentage of Stocks Above or below certain moving averages, deteriorated again today, for example, the percentage of stocks above their 200-day moving average...
 Hit a new all time cycle low today, meaning there are now only 48% of all NYSE stocks still holding their 200-day moving average, widely considered the demarcation between bull and bear market on a primary trend basis while a mere 2 months ago this average remained around 80-85%.

 
If you're a long term trend trader then the MCO's signal not only below its averages, but below zero and near -1500, would have you on a long term trend short.

There's very little in the way of a silver lining except how oversold the market is and yesterday's divegrence, meanwhile at the same time, before all of this happened, I posted Friday that...oversold can quickly turn in to bear material, that's how this market will end."

We may be headed for that ending, in which case, you'll be glad you have shorts in place as markets fall about 5 times faster than they rise and tend to give back more than they gained. For now though, I'll stick with this week's forecast.


On the Shopping List...

I've already posted FAZ long (XLF short) numerous times, it's one I definitely want exposure to, Financials. Tech is another short, I prefer the Q's and specifically SQQQ (3x short the QQQ) and the one that has treated me the best which I never let go of is SRTY, 3x short IWM which is also like being short small caps.

So on any short term , oversold (breadth) bounce, it's these 3 first and foremost that I prefer as I have exposure to Financials, Tech and small/mid caps, it's kind of the base I like to build out from.

As for SRTY and SQQQ, here's what their charts look like and why I would snatch up some shares (if a 3x leveraged inverse ETF is your kind of trade) on any pullback (of course we'll be watching for signs of such a pullback ending to get the best positioning.


When you look at the longer charts like the 60 min charts, you'll see a near inverse, mirror opposite image of the market, it's at those spots where we have been calling the market's rounding top stage 3 and last week's bounce higher a head fake "Chimney", that you want to really pay attention to on these charts.

SQQQ
 The 60 min chart is a mirror image (inverted) of the broad market's August cycle. I'd say judging by the 3C chart above, we can pretty safely say August 18th-25th or thereabouts was the start of stage 3 for the market's August cycle, breadth tends to show the same thing. To the far right is the head fake "Chimney" for the market last week, look at the leading positive divegrence in SQQQ at that area.

 The 30 min charting leading positive position.

While the price has to follow the daily change in the QQQ, inversely with 3x leverage, the demand for the shares/accumulation does not and often diverges. Because there are so few retail traders looking at the market as a short, I suspect the longs in SQQQ , SRTY and FAZ are what you call, strong hands, they aren't easily driven out by head fake moves and such and it's apparent on the 3C charts.

In other words, professional traders.

 SQQQ 10 min leading positive divegrence at the chimney from last week, while market prices were higher and SQQQ lower, those lower prices were accumulated in size and speed.

 Only the very short term 2 min chart shows any real damage of any kind, thus I love these on any kind of pullback you can get, I actually love them right here as Im not willing to part with them.

SRTY...
 SRTY, IWM 3x short has a different pattern as the IWM is closer to a H&S top, note the accumulation zones, but more interestingly, at the downside reversals, no distribution signals make it out this far, again, evidence of strong hands willing to hold for the long haul.

 Only on a 15 min chart do we see any negative divergence in those areas and they are the weaker relative negative divergences, again, strong hands in these ETFs.

 SRTY 45 min in line with the IWM's downtrend and confirming SRTY's upside with a recent 5 min negative, although not that big or strong, it does give us hope for a pullback to pick up shares at a lower cost basis and lower risk.

Again, the negative divergences here are very small, this is a 2 min chart and other than the 5 min above, that'
s about as far as they go.

Again, vs the watchlist stocks, you see a different quality of divergence here, the kind I would characterize as strong hands.

Don't forget about FAZ on a pullback as well.

Market Update

And here are the divergences I mentioned, except Leading (which were in professional sentiment and yields), I also verified using inverse ETFs.

 QQQ 1 min intraday improvement

QQQ 2 min leading positive divegrence, quite strong and fast for the time frame.

 IWM positive in the area of the head fake, that's what we are looking for...

IWM 2 min chart improving and starting to lead.

IWM 3 min chart still in a positive divgerence.

SPY 2 min improvement

SPY 3 min improvement

And 5 min improvement, this is what we look for to verify a head fake / stop run.

The NYSE TICK chart that was in a lateral range at the last update is trending up.

The Custom SPY/TICK Indicator shows a noticeable improvement in intraday breadth.

The MSI is inline with price, no squeeze anywhere I can see.

This should give us the opportunity to add larger, longer term positions rather than these short term intraday or day to day trades like the current IWM call, however, I like to try to take whatever the market will give within reason.

So far it looks like this week's forecast is still on track...

Trade Idea: Adding to IWM Call Sept. 26th $112

I see enough short term evidence for today's move down being the head fake move we would expect. I see improvement in the QQQ, in SPY, in the IWM and in a couple of leading indicators.

It's important to understand this is a very speculative, very short term position, perhaps a day.

It's the price strength in the overall market I want to use to enter the positions that really matter for the longer term.

I'm still leaving my SRTY, SQQQ, FAZ positions in place so I suppose you could think of the IWM call as a hedge.

HLF Trade Management

Our HLF position is probably one of the most interesting as everything tells you not to enter it short, Buffet, Icahn and several other very large investors in HLF, the day we entered was the biggest 1-day movie up HLF has seen, but the divergences showed distribution so although an emotionally difficult position to enter and one you might not want to be on the other side of people like Icahn, the charts did the talking. Since...

HLF is at a nearly +33% gain.

The Price pattern implied downside target is approx. $39, but those are often overshot and the market's overall tone contributes a lot to the target, but as you see, we are close to the price pattern implied target with yesterday closing around $40.

The red arrows are the last short entry we had in HLF and the 1-day Trend Channel stop is at $46.75 on a close. I suspect HLF would need to put together a bigger base along the white trendline to really get an oversold bounce off the ground, however I want to hold those gains so I'll stop out above $46.75 on a close, this should be lower tomorrow as the Trend Channel continues to lock in gains. I'd likely look for a new entry as there's a possibility this one goes to zero if Ackman is right about it being an Enron-like scam.

In any case, there's the current stop for HLF, I'll update it as we go.


Market Update

This local intraday action is not that important from a call / long position with the Sept 26, $112 IWM call from yesterday which I would add to as a SPECULATIVE trade only. The real importance here is first and foremost an oversold corrective move opens up a lot of positions that are looking really good to great entries, I've been combing through them all day.

Perhaps even more important, the market's inability to hold a divegrence or to form one with this much of an oversold breadth condition, marks a new stage in which you'll quickly understand why the SKEW Index is so elevated so quickly, all out panic decline which is ok with me as my 3x leveraged shorts, especially SRTY are making money by the day and creating a nice overall equity trend line.

This is why the two sentences from the last paragraph of Friday's Daily Wrap were in red last night in last night's daily wrap and repeated at least 3 times, while it's really a pretty myopic event from a short term trade point of view like an IWM speculative call, it is important in telling us what condition this market is in and whether we can still count on some additional positions at better entries with less risk. The divegrence itself is very small and not anything that could do more than light a spark, most of the heavy lifting would have to be done by the numerous small and mid caps that have been hammered in to oblivion.

As for the actual decline it self, it would be expected as we often see a head fake move just like last week, 80% of the time before a reversal so even in this small corrective move's case, the concept still holds and we'd expect to see something like what we are seeing, for example...
First there's a higher draft of volume which usually denotes a short term breaking point in a trend and a reversal, however we have to keep in mind that large volume also came from Friday's Quad witching. The break below local support or in this case a stop-run head fake move would be expected just before an upside turn, the Igloo with Chimney, just upside down.

Just like the August cycle's Chimney last week, just inverted, same concept, any timeframe, any asset.

Note there's some damage done to the IWM's 5 min chart...

There's only one way to verify a head fake move based on why they are there in the first place, last week it was easily verified with distribution in to the move higher. In this case, we want to see stops hit (rising volume) and positive divergences in to those stops being hit telling us they are being accumulated. At the last update the IWM was perfectly in line as 3C confirmed the price trend, in other words, no confirmation of a head fake move, now...


We are seeing a slight positive develop in the area and there are several volume spikes in the area of minor support levels.


While this is a small start, I would not add any more risk (IWM long/Call) until the chart is looking very strong, right now it's not at very strong, it's at the possible beginning of confirming a head fake move.


In any case the latest thus far... DIA, large caps which have held better than small and mid caps, finally seems they are starting to feel the pressure too as Utilities are, a defensive play mentioned this morning in the Morning Update.


This is by far the uglies of the underlying charts, not a hint of a positive divegrence on a 1 min chart, 3C is confirming the lower lows the DIA has made, thus I mentioned large caps as I notice several breaking trendlines as well.

The SPY and Q's are showing at best right now, they are holding up and not giving ground.
 SPY 2 min holding up...

QQQ 1 min holding up, these would be some of the first timeframes to go so the fact they are holding is better than a stick in the eye.

As for the TICK which will usually give us some early trend change warning, ...
The clear downtrend has been broken and replaced by a wide ranging range, there are some pretty deep sell -offs under -1300, this is one you'll want to watch if very short term trade means something to you.

Just don't forget the dominant theme for the week and that is down.

*If you see a post in which I add to the IWM call from yesterday, you'll know the charts have improved significantly.

For now I'm going back to the watchlist looking for nice opportunities that don't require chasing an asset that's already down or an asset that's not ready to move down yet, that's why a small corrective bounce is always helpful with short entries.


Market Update

The decline since approximately 11:50 this morning to present, looks like the kind of short term head fake move for a small divergence of this size (Monday and a little today) that you'd expect to see right before an upside reversal or the corrective move expected early this week based on the deep oversold breadth condition. Usually I'd use such a move to add to the IWM call position opened yesterday , however it has been hard to verify as a head fake move, there's actually some damage with most averages in line or following price. One thing of note expected this week was for HYG to break down and ultimately lead the market lower, it did break down since yesterday's close and has kept losing ground, in fact recently the SPX has been tracking nearly tick for tick with HYG.

I'd still like to see a corrective bounce get off the ground for short set up entries, it may just be too early to say what this is, the failed divegrence I warned Friday would be very dangerous for the market or perhaps the head fake move as the divegrence is about as big as expected Friday.

 These charts are difficult because they are so short term they move fast. The intraday TICK is in slightly better condition and above the downtrend line which was hitting some serious lows in the -1300 area.

The August Cycle's SPY/TICK shows the deterioration in to the head fake move and it continuing on a larger basis which is the dominant theme as this is a move from stage 3 top to stage 4 decline.

Very short term intraday 1 min it looks like a failed test of yesterday's close started the selling as it makes a local new TICK low.

This is why I can't confirm this as a stop run/head fake move because 3C is in line and confirming the price action thus far.

There has been some damage to the longer term 5 min IWM chart on this last move as well.

The Q's are holding up a bit better, AAPL likely has something to do with that.

 And a not so impressive QQQ 5 min chart has maintained its position through this little decline.

 Note the SPY intraday is perfectly in line as well

And so far the 5 min chart is holding up, this is the thing that has me thinking this may be the head fake move that starts the correction from yesterday's positive divegrence we expected for the early part of the  week.

 HYG however is pressuring the market, it's stages are complete, it is in decline even with the support for last week's head fake move. HYG has gapped down today and continued lower which is exactly as expected, HYG leads the market lower as it has led the market for 2 months now.

 HYG in red vs SPX since yesterday's close, however...

A closer look at more recent trade today shows the SPY tick for tick following HYG lower.

I still suspect this is a head fake move, although I obviously have thought the potential for no divegrence or a failed divegrence this week is high and very dangerous for the market.

I'll give it a bit more time to see if it confirms as a head fake move which would or should get the oversold corrective bounce underway.