Friday, October 4, 2013

EOD Market Update

I'm going to try to put together that video I mentioned earlier today as this is a complex subject, but I think very timely and extremely important if you are to put to good use the information we have.

My initial impressions are for some sort of consolidation Monday, perhaps just early in the day. The consolidation can be through time or price. I don't think it will last long and if there are well set up call positions, they should be at their best Monday. The reason I don't think a consolidation will last long is because the charts to support a longer consolidation aren't there, the process is mature.

 IWM 2 min negative intraday has acted more as a consolidation through time than price.

 The 5 min though keeps making higher highs, this stops around 10 and is totally reversed at 15 mins so there;'s a cap on an upside move as well, just more room.

 SPY 2 min negative also acted as a lateral consolidation.

3 min is in line, thus there isn''t much that negative intraday to keep the market negative for long or in consolidation I should say.

Again the 5 min is making higher highs like the IWM.

And at 10 min, we are leading positive. If this move isn't ready now, well, I just don't see much more they could or would need to do with it to accomplish their goals because they aren't turning the negative 15 min and longer charts so it seems this is as far as things can go without a price move.

I'm holding everything, but will lighten the short term load as any move runs out of steam and look to keep it light as I concentrate on the trending positions.

VIX Futures Apathetic

Most of you know that the VIX moves opposite the market, if there's fear in the market of a sell-off, VIX futures are bid for protection, if there's complacency VIX futures are not bid, when this happens the assumption is (by traders) that higher prices are coming or will continue.

For us though there are two different forms of VIX information, the price itself which is all most people see and the underlying trade which is in my opinion, a far better indication.

For the VIX piece to fit the puzzle, first we have to understand what expectations are which are based on a number of individual data points, not a guess or gut feel and expectations are still for the market /  IWM (I use this as a standard because of its resistance area that would represent a breakthrough and because it's a leader of risk on moves) to make a move higher.

IWM 5 and 10 min charts as well as numerous other market averages have been pushing this way.

So does VIX data confirm?

First the VXX short term VIX Futures .
 Here we see 3C weaker than price, this happened this week when they banged the close, first VXX futures saw 3C lagging which was mentioned in a market update hours earlier, then a positive divegrence developed in the market just before the close and they ran up the market in to the close using lower VIX prices.

 Our big picture expectations are the exact opposite and when looking at a 4 hour chart of VXX, it is the exact opposite so that's confirmation of the big picture.

There are several different forms of VIX buy/sell signals using Bollinger Bands, for instance the orange arrow shows VIX prices outside the band and then closing inside, some take that as a sell VIX/Buy the market signal. I prefer a 2-day candle, the first above the band on a close and the second fails to hold and closes inside the band (yellow arrow then red), the last time it happened the VIX sold off. So far today we have the same signal suggesting (if it closes like this), that the VIX sells off and the market bounces which is in line with out expectations.

This is the most important to me, it's the 15 minute ACTUAL VIX futures chart and as mentioned, underlying trade is apathetic by way of a leading negative divegrence. To me this suggests that smart money knows something that most don't, especially with protection not being aggressively bid in to an unsure weekend.

As far as I can see, the VIX is confirming both expectations, the strategic and tactical.

AAPL Should Bounce

I'm not very excited about AAPL long, I think it needs leverage and even then I'm not so excited as to open a position, but I think by putting together individual pieces like XOM, AAPL, etc. along with the Index Futures and market averages, we get a composite of what should happen and we can take advantage of that, but at this point in the game I think it's more important to be looking ahead to the positions that will carry your portfolio to profits over the next year or...

That said, AAPL is not on my core short list.

Earlier today I was not impressed at all by AAPL, but it has made some progress as we near the end of the Friday op-ex pin around the last hour of trade, things usually move a bit more.

 intraday charts are starting to look better.

It was important for this 5 min chart to hold up as without it, a call is not worth the risk.

And along the lines of the IWM 10 min or SPY/XLF 15 min, the AAPL 10 min has a positive enough divergence to believe in a move to the upside, I'd put the target in the $492-$495 area.

XOM Trade Set Up

XOM was first a core short that was closed because it was clear a counter trend bounce was coming, but I'm still looking forward to re-establishing XOM as a core short again at higher levels which I think is probable. It has also been a decent call position since the first call on the same day I covered the core short.

 The red "C" is for a closed Call position, the white "C" is for a call opened and the red "S" is where the core short was covered and each has their gains above for the position, +5%, +39%, +32% and a current call open now.

I like XOM for a call position, I don't think it has enough profit potential for an equity long, but you could always use ERX (3x long energy ETF) which I mentioned the same day the call was opened, I think that position would be worthwhile.

 This daily 3C chart shows why XOM is near the top of the list for core short positrons and why I will re-establish the short equity position at higher prices.

The 2 hour chart shows distribution at the July top and a small divergence now suggesting more upside on the counter trend bounce, although there is no real primary trend yet other than lateral.

 The 30 min chart's negative and positive as well as the reversal process in orange, it looks like a call in XOM is well worth the risk even here.

However if there's any chance to get a call opened at lower levels (in red), that would be my preference.

You can see the short term opportunity pretty clearly, when looking at the daily chart you ccan see the long term trending trade opportunity very clearly, so I'm just trying to take what the market is giving here, but in doing that I'm also executing my main strategy, ride XOM up with a call to make some gains, but the most important thing for me is to re-enter the trend position short at higher prices.

I think we get higher prices, but I don't think they hold for long.

Market Update - IWM

First, intraday here's the TICK chart, it's clearly going negative so intraday we are definitely toppy here.

 This is my custom TICK Indicator, it's like MACD, but instead of using two moving averages, it uses the linear regression of the SPX vs. the linear regression of the TICK. The TICK should stay strong on a move up, here you can see more and more stocks are refusing to move higher so the intraday breadth is coming apart.

This is the R2K Futures 5 min chart which is positive, I showed it several times this week and last night.

This is a big part of why I think we get another leg up and that fits with the expectations as well as I have expected the ascending triangle in the IWM to see a breakout, that's where I think we see a lot of very heavy distribution, not to say we don't already have that. What I'm saying is the ascending (bullish) triangle isn't there by coincidence, this in my view is part of a set up cycle to accomplish a goal, to get retail bullish and provide Wall St. with demand to short in to, a breakout above such an obvious ascending triangle would go a long way towards that goal. By the way, this has been our view since we saw the triangle forming.

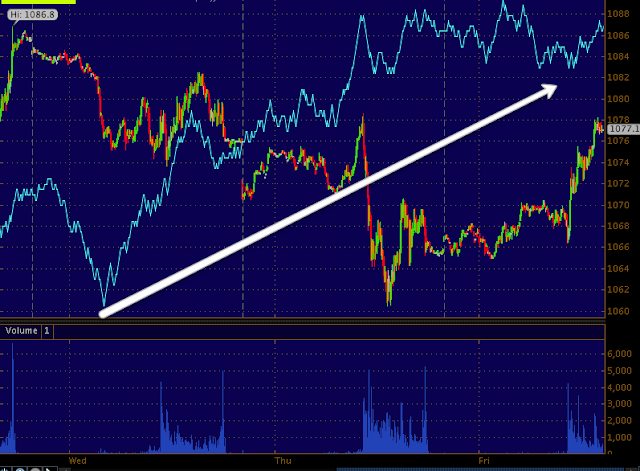
 IWM 2 min intraday losing 3C.


the 3 min chart is as well, I drew is a rough pullback, I'm not predicting targets here, just giving an idea of what I think is most likely to occur.

On the 5 min IWM chart I'm trying to show how much accumulation I believe there was for this cycle and how much distribution we are seeing roughly which leaves room for another leg up as the real distribution target is a break out above the triangle where retail will chase it.

In a moment though I hope to show you how insignificant this is to the big picture. I've said this before and I still believe it, "We are not 'near' the big picture, we are well within it".

This 10 min IWM chart shows the ascending triangle and the current action, again I drew in a pullback which I think is starting now and another leg up which is the breakout above the triangle.

Again, this is important for near term trade, it's tactically important for longer term strategic planning, but the price move itself is insignificant in the larger view of the market.

At 15 mins, there's a clear distinction between the last 10 min chart and the leading negative of this 15 min chart. In other words, the market is already exceptionally fragile right now. Again I drew in what has been my expectation, this is nothing new.

Looking at a 2 hour chart of the IWM, the very strong leading negative divegrence and what could be a H&S top, but I think more likely will be a broadening top. If you follow the red line I drew, that slight jiggle to the upside is what the breakout above the ascending triangle would represent to the larger picture, again it's insignificant as far as price, but it's very significant as far as strategic planning and tactical execution of core short positions.

Quick Market Update

Intraday we look to be getting toppy here, I would say we are on the edge of an intraday pullback.

However, I believe after that we'll have another leg higher, whether it can put that leg together today or not, well I doubt it with op-ex and all.

I'll post some charts, but if you just recall the IWM futures and the others from last night, they are more indicative of that next leg higher, but at the same time that next leg higher needs to be used in my view for long term shorts/core positions.

I'll get some charts up next.

GOOG Charts

Here are the charts for GOOG. This is an example of what I want to show you, maybe not the best, but it makes the point.

I think it's a personal decision as to how much risk you can tolerate, how much patience you have (which is a big one because not a lot of traders can sit through a couple of weeks without putting on a trade)  and how much draw down you can tolerate. There are hedging strategies that I think are probably a good strategy to explore, like short term calls maybe out to November or so because it does seem like we will still get this bounce, but when you put the bounce, even a strong one, in perspective, it's very hard for me to justify not having a longer term core short position in place. When I say core short, I generally mean an equity short with no leverage that is meant as a longer term trending trade.

Their are other considerations such as whether you have the time to watch over some of the shorter term trades and a big one for me is how many trades you have open at once. I'm not a believer in over-diversification because there's very little rotation in the market, everything is pretty well correlated, either risk on or off. So, I'd rather have 6-10 decent positions than 20, I just don't see the need for it, I think you can diversify enough with 6-10 considering how correlated the market is.

Perhaps after you see the charts, it will make more sense, but I really think this is the time to really decide how you want to approach the market strategically that fits your personality, time, etc.

 GOOG 1 min intraday and this is largely where the trade is. I think price can come down a bit and offer a better entry, but at some point the micro-managing I think risks losing sight of what's really important, unless you have that kind of time and are suited to that kind of trading.

Put another way, I'd say it's time to make decisions about making a transition from using a scalpel to using a more blunt instrument, to decide how much or how many shorter term trades you want to be involved with (this is just a function of where the market is, these are the trades that have been working) and how much you might want to transition to a broader view, but understanding with that broader view comes some draw down which is insignificant in the broader context, but can still be annoying day to day, those are all personal decisions.

 2 min GOOG is building out so it's starting to look like a good candidate for a MCP-type trade, leveraged and short term with short duration market risk as a long position.


 The 3 min chart is building out. I'm of the mind right now that I'd rather see the 5 min chart show clear positives before considering a call position in GOOG.

The 5 min with a relative positive, very weak at this point, but it could build out as the intraday 1-3 min charts have. I'd have to see if GOOG's price at that point still offered a reasonable entry.

This is the 60 min chart, try to imagine how much upside we might get from a 3 or 5 min positive divergence. I doubt it would be a new high, I think it would be more like the recent swings and with options that can be worthwhile for double digit gains, but that 3C chart is not going to improve, if anything it will get worse.

This daily chart is extreme, but this is how bad things are. This is why I am really bringing the subject up. If I were a longer term trader with patience and day to day gyrations didn't bother me, I used wider stops and took on fewer shares and didn't want to be bothered with watching the stock every day, I'd pretty much be trading GOOG from the short side, I'd be entering full positions and just being patient with them.

For a lot of us, that's a lot easier said than done, especially if you watch the market all day as many of us do and you see these short term opportunities to make a quick 30 or 40% in a day or so.


GOOG Looks Like It Will Run Higher For A Short Time

This is probably a decent call position for a quick trade, it may be a 1- day or so.

There are a number of assets that I'm compiling because I think they give a good overall picture of where the market is.

In many ways I'm starting to feel like an ideal situation for many of these assets is short term leveraged calls for a move to the upside with equity shorts phased in, entered in whole with the calls hedging them or add to.

I'm going to try to get either a video or a couple of examples up.

I'm going to look closer at GOOG and if I think it's worth the trade I'll obviously put it up.

MCP Follow Up

Earlier this week the phased out exit from MCP calls gave an average return of 42% so I can't be too upset, however in the SCBO (Second Chance Buying Opportunity) Post I posted that I thought MCP would pullback to the 10-bar moving average on a 60 min chart as per the norm when using our X-Over system which not only helps determine a real crossover from a whipsaw, but is also a trading system in itself that tells you where the likely first pullback will be, where the 2nd and 3rd pullbacks will be and when the asset is starting to undergo change that is likely to end the trend.

3C can give earlier warning, but overall, I think this is a neat, tidy little trading system.

Our pullback target for MCP after having taken profits on the run up was in the $7.20 area, MCP hit that yesterday and took off this morning for a +4.7% gain.

I don't or didn't feel strong about the action in underlying trade when the pullback took place yesterday so I didn't open a new position, but for those of you who did, this is what we have so far.

 Daily chart of the 4 stages, MCP is very close to a breakout to stage 2 mark up which is the easy money or trending part of the cycle.

This is a 1 min chart of the pullback yesterday to the $7.20 area and this morning's launch from the area.

 This is the X-over system which has stayed long with all 3 indicator panels and it saw price touch the yellow 10-bar moving average as is often the case for the first correction after a new signal is given.

The larger daily 3C chart shows the stages, the 3C divergences that correspond with each stage including the current base stage.

This is the 5 min MCP chart, this is what I wasn't too excited about yesterday, it just seemed like MCP needed some more time to gather strength so I skipped the trade.

The yellow area was our pullback target posted before it reached the area in this trade set-up post from yesterday morning.

 So far intraday we don't have the kind of support MCP needs to sustain a move higher so I'll set some alerts for a shallow consolidation and look to see if this situation has improved which may offer that SCBO.

Thus far the Trend Channel is holding this trend, you can see how close a 22-bar moving average is to the Trend Channel as a stop, for now if you don't have the T.C., a 22-bar on a 60 min chart should work fine as a trailing stop, but the moving average doesn't have the same ability to recognize a normal consolidation and keep the trade making money with appropriately locked in gains, the moving average is either too far or too close most of the time, but for today it should be fine.

Crude Oil /USO Follow Up

I mentioned that overnight action developing in 3C since last night's midnight futures report showed the probability of a pullback in gold, silver and oil, but oil looked to be the shortest of the 3.

We do have an open USO Call which could be closed right now at a very small single digit loss, but I am confident we have enough time on the contract (November) and I feel this is a small corrective move, so I'm ok with holding it.

Here are the charts showing what happened overnight in Crude Futures, these are Brent, not WTI.
 Crude 1 min futures overnight in to the open.

The 5 min futures diverged at the exact same area.

The 15 min futures are still holding a positive so it is not too concerning

And the distinct change in character in USO is the real story here. The price pattern alone suggested this would happen considering the way retail traders view the market and the way Wall St. takes advantage of them. In conclusion I don't see this as being much more serious than a gap fill and am not going to close any positions over it, I feel it would be a greater risk to not have the open exposure to crude (long) at this point, kind of like the AAPL (-45% drop) lesson.


PMs

So far 3C's overnight Precious Metals futures reaction has proven accurate, but I also wanted to show you the other-side of the coin and why in my estimation this is more rotational or maybe some further base building, but not bearish activity.

 Early opening action in gold has been just as 3C was suggesting, down.

The same is true of silver.

However the charts that count like GLD's 30 min leading positive suggest that this is temporary price action and it's likely for a bullish cause like strengthening a base or perhaps just rotational, later we should be able to see accumulation in to the move to the downside which would give further credibility to the analysis.

This is SLV's 60 min 3C chart with a strong leading positive divergence, but if you look at the base of price alone, it's almost like a spinning top with a "v" for support at the bottom, adding a second leg to the bottom of the base would greatly enhance both PM's ability to rally further and hold gains longer.

Pre-Market Futures

I hope you saw my Midnight Futures last night / this morning.

Not much has changed, in fact the Index futures continue to gain upward 3C momentum. The only differences I noted pre-market were gold and silver look as if they'll consolidate/pullback, but this is likely part of a larger base, it does not look like bearish activity for either PM. Oil also looks like it will pullback, that looks more like it may be an intraday pullback, but being Op-Ex Friday as every Friday, who knows.

Treasuries are flat.

I'm thinking the USD/JPY cross or at least $USD strength that I mentioned last night is likely responsible for the PMs and oil as well as the more bullish look to Index average underlying tone as the USD/JPY is a carry cross currency pair.

Midnight Futures Actually Look Active

First futures gave no support, in fact the opposite, then last night they were nearly perfectly in line and today or tonight, they are supportive. If I were to put the above sentence in to candle stick vernacular or represent it with a candlestick chart, it would be a long negative candle down, a star or Doji representing the stalling of the downtrend and a confirmation reversal upside candle.

Take a look...
 ES 5 min clearly positive, maintaining momentum in to the overnight session

 NQ was positive on the 1 min which was a huge improvement for the NASDAQ as it has been the WORST looking average BY FAR for the last week. NOW we have a 5 min positive divegrence showing up and out of a bear pennant which is like a bear flag, the perfect head fake price pattern.

 TF-Russell 2k Futures are the strongest (5 min) as they should be, the R2K should lead all risk on moves/rallies.

Even the 30 min chart is now going positive, actually this started last week and picked up momentum last Friday.

Just as a reminder though of the big picture, this is the R2K Futes daily, this is as clear as you get, the path of least resistance is DOWN, but nothing moves straight up or down, thus the 5-30 min positives.

However, with this knowledge, you should be planning on how you want to use any market strength in the near future.

Having decent overnight market activity can be helpful for a bounce, the Nikkei is looking a lot better in the near term.
Nikkei 225 futures with a 15 min positive and what looks like a rounding bottom or reversal process.

Interestingly, the VAMPIRE SQUID, better known as Goldman Sachs who trades against their own clients, is out with some free advice from Mr. Stoppler, which is an ironic name because the last 6 or 7 trade recommendations he's put out have been "Stop-plerred" out. 

Today GS and the Stop man put out some FREE trading advice and rec'd:

"We recommend going short $/JPY at current levels of about 97.30 for a tactical target of 94.00, with a stop on a close above 98.80." 

Short the USD/JPY huh? Free advice from Goldman huh? Other than the fact the trade is a 2:1 risk/reward ratio, WELL BELOW the minimum of 3:1 any decent trader would consider to be the bare minimum, the fact is GS fully expects this trade to be stopped out because they don't spend millions on research to give you their trade ideas and have you competing and taking away their edge and profit, they aren't a charity.

This simply means, GS is buying $USD/JPY, they aren't dumb, that means a risk on currency pair should be seeing upside action and that's helpful to the market, but what does 3C show?
 15 min Yen futures look a little negative...

15 min $USDX futures look VERY positive, so despite their recommendation, it looks like the USD/JPY pair is set to gain, stopping out those taking advantage of Goldman's generosity and making GS money as well as providing a risk on carry pair a potential engine for higher market prices!

Finally the SPY...
 Daily candles show a pack of them in a range with a Doji at the end, then at 2 a Star (bullish reversal candle) on increasing volume makes good and reverses to the upside the next day. We have a Hammer-like candle today, not a perfect hammer, but lower prices were rejected on increasing volume, it's not a technical reversal candle, but the trading action is the same despite the definition not being exact.

And on a 60 min chart, what do you see? A Reversal process? At this point it's a bit larger than I expected so maybe we do get a move to the upside just a tad stronger than expected and there are so many shorts out there that just need that little push.

Take a look at the daily TF/R2K futures above again and think about that, then think about a weak underlying move to the upside, if that doesn't say market gift to you, then watch what we do with it and next time you are presented with a similar situation, you'll have the confidence to take advantage of a deceiving price move that leads to beautiful set ups with low risk and a HELL of a lot better risk:reward ratios of 3:1, more like an average of 8:1 or more.

Just like I have been saying, "We are too close for Wall St. not to take advantage of this" and since we are taking our cues from those running the game, we take advantage too.

Tonight's post was almost about all fo the great looking shorts, but lets just get to where we need to be, LET THE TRADE COME TO US and there will be plenty for everyone.

Here's one of my new favorites.
 5-day TSLA chart. Parabolic moves remind me of the saying, "The bigger they are, the harder they fall"

60 min 3C, notice any changes?

The short term is offering a gift on this 3 min chart, you see what it is?

My Trend Channel performed beautifully, that jog in the middle didn't close below the lower channel line so no stop, but now, we are VERY close. $169.50 on a 2-day chart is where the character changes enough to change the trend.

There are Hundreds more even better than this.