This morning obviously would have been the rumor and at last check 11 p.m. tonight is when it becomes actual news just in time as we and probably everyone thought.
So where do we go from now and how do we play it? Lets take a look at what we have.
Since we just got done looking at "Carry trades" and how currencies effect the market, the leader of the 3 major pairs today was the AUD/JPY, however as I talked about in the last post and recently the last couple of days, the Yen is changing in a way that is not conducive to supporting carry trades as the 3 majors all end with "JPY".
Here's one of several charts that looks like the Yen has found for now, looks to be some sub-intermediate base.
It's not just the range which is characteristic of accumulation (in this case), but even the head fake moves we see or stop runs (in this case) that occur just before a reversal in about 80% of reversals.
What may be more damning for the market is the Index Futures (ES, NQ and TF - SPX, NASDAQ 100 and Russell 2000 futures respectively).
These had been negative on 5 min charts, but the longer the chart, the more serious the divegrence, in 2 0f 3 we have clear negatives on the 30 min chart (the 3rd is negative on a 15 min), that's through the 5 min, through the 15 and to the 30 min. Take a look and I'll point out something else of interest that worked exactly as it should have.
This is the ES (SPX Futures) 30 min chart, before we look at the negative divegrence to the right, look at the positive divegrence at the white arrow.
You may or may not recall that on October 9th, my Custom "Buy/Sell" indicator inspired by DeMark principles gave a rare "Sell" signal in the spot VIX.
The positive divegrence in ES above correlates exactly with the red sell signal in the VIX and the VIX has come down since (remember the VIX trades opposite the market so a sell signal would cause you to expect the market to rise).
In the
"Daily Wrap" of October 9th when I showed the chart of the sell signal (click the link to read the article), I had talked about a reasonable size reversal process in place for a move to the upside, showed the VIX sell signal, and ended with...
"
So the play is to ride the upside, I call it "Hitch-hiking" until we get in to the upper end of the range or above it and look to close out the leveraged long and look to enter or add to the core short position."
All of the Index averages have positive divergences right at the 9th, the same time as our VIX Sell signal (you can't see it on the NASDAQ chart below because it's a shorter 15 min chart rather than the 30 of ES and TF).
What you'll also notice is all 3 Index futures have clear negative divergences now, take a look at ES above or NQ below.
NQ 15 min shows Friday and the last 2 hours of the day when we started to see some distribution, I figured it was light and likely for a pullback, however it looks like it was the start of selling in to higher prices and a larger negative divegrence/distribution.
I tell members who use 3C, "If there's no clear signal, look at the trend or longer chart".
The 30 min chart gives a very clear trend of accumulation in to the low of the 9th, this was just after I had been talking about the market needing a larger reversal process and the action around the 9th provided it.
The green arrows are 3C/price trend confirmation, meaning everything looks fine with price as far as 3C is concerned.
The red arrow is obviously a negative divegrence, as is typical they start with a weaker relative as we see first and are followed by a stronger leading divegrence.
For the Russell 2000, this is exactly the kind of move I had expected, a move ABOVE the 10/1 highs, for other stocks like NFLX, we aren't there yet as a move above $334.50 (as mentioned earlier) is what I'm looking for , not just in NFLX, but many assets, still others are in the zone.
The market tends to be extreme, so a head fake move is usually not just a slight break of resistance or support, they have to be convincing and there's a reason why.
If you haven't had the chance yet, try to read these two articles I wrote,
Understanding the Head Fake Move: How Technical Analysis Went from an Asset to a Trap
and...
Understanding the Head Fake Move: Motivation
(Both articles are linked at the top right of the member's page)
This explains why these moves occur so frequently and why in this case, they benefit Wall St and in many cases in which we are setting up trending trades, us as well.
If I had to guess based on the concepts alone, I'd say the market can remain extreme and they can use whatever tools at their disposal from the SPY arbitrage intraday to Carry Trades to flat out support of highly weighted stocks, although fooling around with VXX seems to be one of the preferred methods that likely costs a lot less.
I'll show you both sides as best I can and quite honestly we can't rule out something as simple as a move to the downside to regroup and a push to the upside over these resistance points, that may be what explains numerous signals.
The fact is a day like today is very difficult to get good analysis from as it's a fundamental, emotional event that often isn't efficiently discounted because no one knows what shape the final resolution will take- we still don't (not to mention unforeseen consequences, i.e. Fitch).
At the end of the day I mentioned how flat, not only the averages were, but almost every stock out there and I suspected there was likely something going on around VWAP (Volume Weighted Average Price) which is the area a specialist or market maker tries to fill institutional buy or sell orders, the better the fill the more business they are likely to get.
HFTs have largely taken over the liquidity role, essentially doing what day traders were doing 15 years ago when a T1 line was considered fast and that's scalping or trying to get in front of the market maker and essentially perform that task.
This is ES and VWAP for today from 5 a.m. EDT to about 5 p.m. Typically a fill for a buy order would be at VWAP or at the lower channel (almost always an average) and selling is at or above VWAP. It's kind of interesting that the market sat near VWAP later in the afternoon.
Considering what the market is doing, it's getting interesting again to see what smart money is doing and I don't just mean 3C above, I mean the CONTEXT model for ES (SPX Futures). When the market gapped down Sunday night, it gapped almost exactly to the level CONTEXT was modeling, missing it only by a few percent.
As of tonight...
Shortly after the opening move higher which was the momentum move of the day with the rest of the day more or less range bound, the assets that make up CONTEXT were selling off, smart money was apparently moving out pretty quickly and there's now about a -19 ES point differential between ES and the model, whereas it had recently been flat around +/- 2 points. These are institutional sellers of risk assets because very few retail traders are trading Credit risk, Carry Trades, interest rates and curves, etc.), these are institutional risk assets.
As far as some of what I saw today, a lot of it was just getting started, remember other than a short duration pullback, this is the move to the upside we've been expecting and pretty darn close to the area we've been expecting.
HYG (High Yield Corporate Credit) is a risk asset institutional traders use often, because of that, it also happens to be one of the 3 assets used in SPY or market arbitrage, the other two are
VXX (Short Term VIX Futures) and TLT (20+ year Treasuries). The basic idea of arbitrage manipulation is algos/computers see HYG (an institutional risk asset) moving up and they assume professionals are buying, so the algos buy. At the same time to make it effective, the VIX should fall so they look for VXX to fall and because Treasuries have long been considered a "Flight to Safety " trade, TLT falling as well all help with intraday or very short term manipulation of the market.
HYG up, VXX down and TLT down = positive market arbitrage
HYG down, VXX up and TLT up= negative SPY arbitrage
The computers are just trying to figure out if there's a flight to safety or a risk on move and they are buying and selling based on that; earlier today I snapped the Arb. model because I saw HYG moving uncharacteristically, I took a later screen shot and as I suspected, there was an effort to activate SPY buying which are charts I showed you today. In fact, just before the news came out and the market shot up this morning, VIX futures were hit first with selling.
So
HYG performed a little better than even the SPX, however at the same time High Yield
JUNK Credit which usually performs almost exactly the same as HYG (however is NOT an arbitrage asset so there's no utility in manipulating it) traded worse.
*
These are considered Leading Indicators the way we use them, the comparison symbol will always be the SPX in green unless otherwise noted*
HYG performed almost exactly like the market, but had better momentum from 12 p.m. to 2 p.m. when the SPX was flat and also had better relative performance at the dip just before and in to the closing ramp attempt.
JUNK Credit however was more similar to the SPX and didn't participate at all in the last hour and a half ramp attempt.
The much more sensitive High Yield credit (due to tighter liquidity) acted totally different as it has no correlation to anything market moving.
This was the most supportive risk asset especially among credit since the end of September, actually leading the SPX...
HY was very strong off the Oct. 9 bottom, then faded pretty quickly, it lost more ground today with ZERO participation. The issue with HY Credit as I've seen once before, if traders with decent size (institutional) positions need to get out fast, the thin liquidity can send this down fast and hard (I've seen it erase a year of gains in 2-days) so it's usually the fist institutional credit asset to react.
As for our Leading sentiment indicators,
You can see how this showed bullish sentiment almost 2-days before the market moved to the upside, it's been showing negative sentiment about the same length of time.
Our second indicator for sentiment is showing similar, but more dramatic negative sentiment.
Essentially, the pros are packing it in.
As for longer term...
The first sign of trouble was in to the May 22nd 1-day Key Reversal and of course now things are a lot worse which fit with numerous other indications, this is the big picture so in my view, the choices made in this area are very serious.
Yields are another asset we use, they tend to lead the market and almost act like a magnet pulling the market toward them until they meet up. Today's action in Yields wasn't very good for the market.
Notice how Yields are leading the market well before the SPX hit the Oct 9 low (Monday there's no data as the bond market was closed for Columbus Day). Today Yields led the market lower almost vertically. I don't like to look at 1 day of information and give it to much weight, but this market is in a very volatile, fast moving area so it can't be discounted either. Obviously tomorrow's data will be important.
A few other things of note, today's Spot VIX saw the largest 1-day move to the downside all year.
Today's candle is huge.
Although we had a sell signal in the VIX and this is consistent with that sell signal, I think a lot of today's downside action in the VIX was simply protection that had been bought over the past weeks as no one knew how or when or even if the D.C. stand-off would end and it was simply being unwound. In some way I have to wonder if this didn't create a short duration exhaustion event in the VIX.
You may remember 3C on a 15 min chart was showing us a negative divergence in he VIX Futures around the time the sell signal came.
There was a very late day (intraday) negative right in to the close and open this morning of VIX futures sending them lower, however there was also a positive divegrence building since about noon time which is when the market was starting to range.
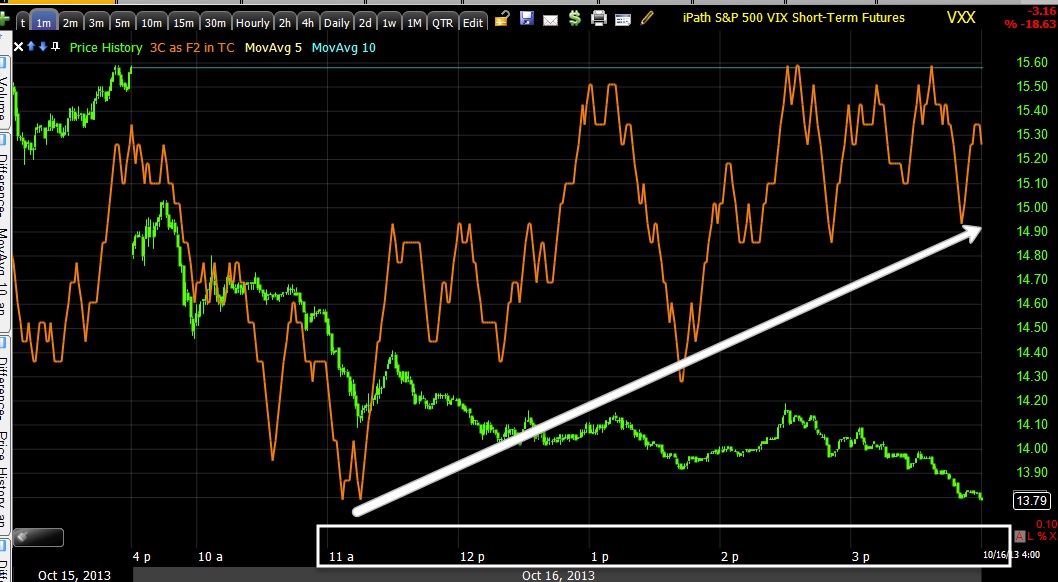
VXX/UVXY are also interesting, not only because they showed the distribution going in to the
VIX sell signal which allowed us to make +40% in 4 hours (see the link from the trade) believe we made 40% on VXX short based on those signals in 1 day, but also because of what's happening now and how the 3C signal mirrors the VIX futures (price between short term VIX futures and VXX should match, but underlying trade can be VERY different).
This is VXX intraday, the same positive divegrence as VIX Futures at the same time.
However look at the same chart zoomed out to reveal the trend, note the distribution in to Oct. 9th which is what gave us our short VXX signal and check the large leading positive divegrence around the 14/15th and today.
I can't say some or a lot of this won't be unwound, but it seems what was going to be unwound was already done today. A 1-min chart can EASILY confirm distribution in unwinding this position and could have done it in the first 30 minutes of trade.
This is why I have very little problem holding VXX November Calls or VXX / UVXY long (equity).
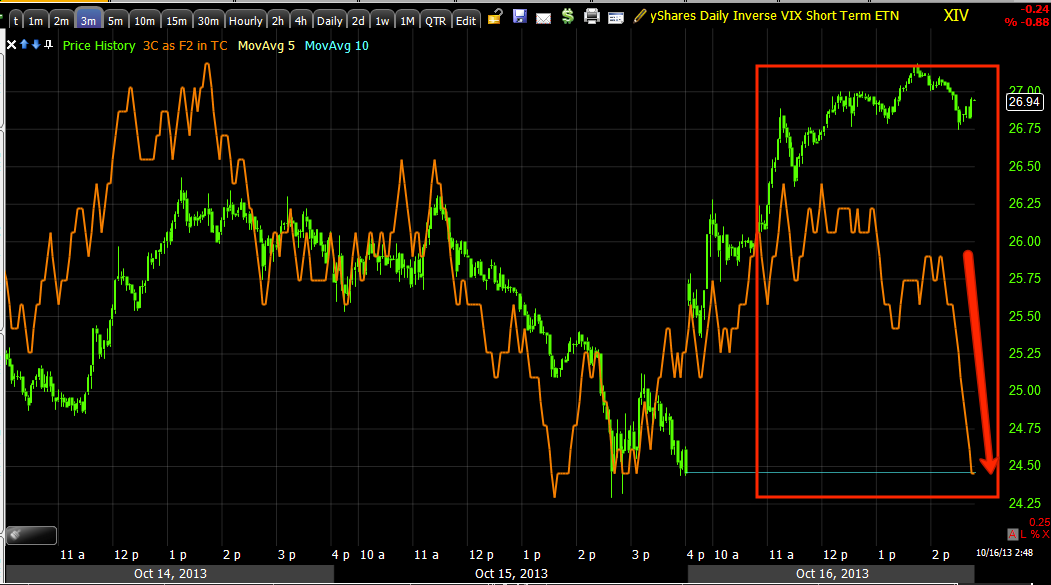
This is a 10-min chart of UVXY (some people think ProShares tracks better) and it has a clear leading positive just before VXX/UVXY launched and a clear leading positive divegrence like the 1 min chart above.
I'm honestly not sure what to think of this because even a 10-min chart could have confirmed the downside in a few hours today sending 3C down to the same level as price, it seems to me something is going on here. (Remember VIX trades opposite of the market).
The CBOE SKEW Index is another that's interesting, this is sometimes called the "Black Swan" index, meaning a market crash. I really don't have enough historical data (CBOE does, but they didn't release historical data) to test the efficiency of the Index,
I know I have very little respect for the famous Hindenburg Omen, we've seen how many now and in clusters?
So again, I don't know how much weight to give this, but a couple of weeks ago I posted what I thought was a change in the ROC and sure enough...
What I do know is that this is meant to predict an unpredictable event or a "Black Swan market crash". The normal reading is 115, up here at 133 it is elevated and what the CXBOE would probably label as a warning flag.
Other than that, HYG had been building accumulation a month or so ago and this is one of the reasons I suspected the up cycle along with other reasons, today there was some intraday distribution in HYG, but it seemed they were leaning on HYG pretty hard to help the market at the EOD.
I would expect to see VERY strong distribution in HYG before a market crash, I think we could see a volatile correction with much less, but otherwise we have seen strong distribution and HYG dislocate with the SPX, I'd expect to see that, but in this market I think you have to not be too rigid and be open to what the market is showing you.
Again today there was no Dominant Price / Volume relationship among any of the major averages.
As most of you know, based on our concepts (here I'm talking specifically about the articles "Understanding the Head Fake Move" linked above)
, signals, etc, there are so many great looking shorts that are in a position like the SPX chart below, I fully expected a head fake move in a lot of them like the NFLX chart I showed today.
The SPX isn't the best proxy because a lot of these have clearly defined resistance or double tops and a break above those areas is what I expected from this move. I'm going to look at a larger watchlist and see how many actually made that move, but there are quite a few bellwethers I expected to that didn't. This isn't to say anything of action for the next several days, there are a lot of ways it can play out and there may be information that tells us we have to change our expectations, for instance perhaps that move is as close as it's going to get.
A lot of you may remember my AAPL short at the top, I clearly expected a head fake move higher and it looked very probable, then Dan Loeb's Third Point Fund released their holdings and AAPL was no longer on the top 5 and immediately all the hedgies sold at once dropping AAPL 390 points of -45%, that's a fundamental even only Loeb knew about, so we may have a similar situation with this event as well as unexpected circumstances like the F_E_D acting differently because they obviously held off on the taper because of this ordeal, if it's a done deal, we may be taper on. Fitch may downgrade US debt, there are so many variables when a fundamental event like this occurs that is next to impossible for the market to discount.
Bottom line, we did see negative divergences today in the averages, in the index futures, we saw confirming signals in VIX futures (VXX, etc), however based on the move to the upside, I'd expect early limit orders from the 9 to 5-ers as they chase today's move, so a.m. trade would seem to me to be volatile and likely filled with early limits, UNLSS FUTURES GO SOUTH TONIGHT.
This is VERY early, but since I saw it develop as I've been putting this post together, I thought I'd include it.
I already shoed a positive (larger) base forming in the JPY/Yen, which can basically kill any of the carry trades that have been used to help move the market. I recently have been using a new analogy, "The longer term divergences are like the promise of something locked in a chest, the short term divergences are like the key".
This may not be much, but at the lows and because it coincides with Nikkei 225 futures, I thought this 1 min JPY leading positive divegrence may be important.
Further along and in to today, the 5 min JPY leading positive divegrence is already in place.
A rising Yen wouldn't be good for the Asian overnight market or at least the Nikkei 225, here are the 225's Futures...
At the same time and high (vs the Yen low), there's a similarly confirming leading negative, this is still intraday 1 min and usually not something that holds overnight unless it continues building.
What really caught my eye though was the Russell 2000 Futures, TF 1 min
That's a pretty impressive leading negative divegrence , NQ may also be starting a similar divergence, but I'm going to let that have some time before posting it.
We already know the TF 30 min chart is in some trouble...
I wouldn't normally say this is so extreme that it's jumping off the charts and I can't ignore it, meaning I'd have to take a position, but it's clear deterioration. When all of the intraday charts link up to this one, that's when the fireworks start.
Lastly, in addition since capturing CONTEXT earlier, the dislocation has grown.
context

Of course I'll check futures again in a few hours and see if we have an early edge.