Friday, September 10, 2010

Couple of quick observations....

You know I'm working this weekend on a few different angles, but I thought about this. If you wanted to take the market down for maximum effect or do anything for maximum effect, wouldn't it make sense that you had all the players in place?

This week was Rosh Hashanah (the Jewish New Year), surely the trading desks were not at capacity. It got me thinking about low volume and the high volatility moved that come with it. Think bout all the low volume stocks we made big money in with one or two day moves. One gained 180% in three days, but it was their low price and volume that really made them move.

So I ran a very simple backtest , it wasn't optimized or even well though out, it was just to see the effects of trading during volatile times. So I used a volatility indicator that goes from 1-100, 100 being the highest volatility and I set up a simple buy/sell short system. When price falls below a 75 day moving average you go short, when if is above the average you go long, so long as volatility is under 30. When volatility rises above 30, you exit all trades. This has you sitting out long periods of the market, sometimes 6 or 7 month stretches. You miss a lot of price action, but guess what, it outperformed buy and hold by 17% as tested over a 4 year to date period. I've told many of you over the past months that tops are volatile and they are like meat grinders for most trader's accounts.

Running the same scan with the same buy/sell short criteria, except this time being in the market all the time, with no volatility conditions, I found that this scan underperformed the above by -10%.

To put this to practical use, you might consider scaling back your position sizes during volatile periods. I'm sure I'll work more on this and optimize it for better results, to find the volatility level that gives the best performance and a better entry exit system.

I ran one other scan, this time I went long the IWM, no leverage just long or short with a 7% stop-loss. The condition was to buy the IWM when UUP (a proxy for the dollar index) made a 10 day high or a 10 day low, again this was not optimized. Simply put, if UUP drops to a 10 day low you buy the IWM (Russell 2000 ETF with no leverage). If UUP makes a new 10 day high, you sell short the IWM. The system is always in the market either long or short and over a 3 year test period, the system returned 200%. Not bad huh? Most Hedge Fund managers can't match half that performance. Here's a screen shot. The bottom equity line is simple buy and hold as Wall Street has preached for decades, you can see it severely under performs and your account would have lost 18% over the test period. Clearly there's a correlation between the dollar and the markets.

While the chart shows the SPY, the IWM was the symbol tested. Note the equity line nearly doubled.


More coming this weekend....

Don't Underestimate Volume or the Close

Remember this about volume, for advancing price to be healthy, you need advancing volume. Falling prices do not need volume confirmation, but if volume does rise, it indicates panic selling. If this occurs during a stage 3 top, it is important in showing investors fear. If it occurs after a prolonged downtrend/bear market, then it can mean the end of the bear market is near.
Here is the tech rally from 1990-2000. Note that the majority of the trend we saw a steady advance in price and volume, a confirmed healthy trend. The sudden jump in prices and volume in 2000 was extreme volatility that warns of a top, like I showed you earlier today with the channel .
Here's a closer look at the importance of volume, even in swings of price. The volume indicator is the blue line and when we see a green box we have a healthy trend, when we see a red box volume fades into rising prices and we get a swing correction in prices noted by the red arrows. Keep in mind, this is still a large bull market in the tech bubble.
Now we are looking at our current top-the volume indicator is purple. Again, at each red box is a reversal, but preceding that reversal is an uptrend in prices on fading volume. Each white arrow shows the fading volume, each red arrow shows the trend in price after. Note that every advance that has turned down was a rally with diminishing volume. The volume tends to rise on the price declines, indicating investor fear.
This is the same chart, without all the annotations so you may see it for yourself. Look at our current advance and the volume indicator.

There are very few exceptions if any on these charts. Fading volume into rising prices is a time-b-mb  (don't want my site flagged).

So with everything else we know, keep this in mind.

Important Stock's Close


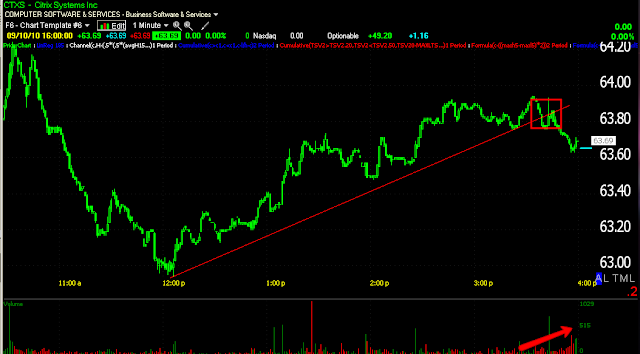
Looking at the close of many of these stocks, it clearly looks like a reversal was underway, the break of the trendline (in a few you'll notice the kiss goodbye I mentioned today) and the volume all show these to be pretty serious.

I am going to post more this weekend, and one thing I will work on ins the market weighting indicator. I saw in the Dow alone, the stocks they had to keep up to close the Dow higher, they did, even if they struggled. I do believe there is manipulation going on here, but with the volume dropping off like it is, it will be harder and harder to find retail Joes in sufficient quantity to keep this alive. Technically speaking, the market-SPY, could not close above the resistance from yesterday so the attempt was failed. If smart money is distributing, they will not start buying when buyers dry up as they are, it's counter productive to their goals.

Lets see what i can come up with on the indicator front. If anyone can find a current NASDAQ 100 weighting of the average, that would be very helpful.

Keep an eye out for more posts this weekend, but the ideas I'm giving you to trade, will make money apparently, so long as they are not key weighted stocks in the index, as others seem to want to fall apart.

Have a great weekend.

Both SPY and DIA

Have broken their uptrend line since 12:00 today on good volume. Heavy hitters like GOOG and AAPL are moving into the red. This isn't the close a bull would want to see. It's not ours either, but all things considered, including the last two major reversals occurring on a Monday and Wednesday, I'm not in a panic. I am frustrated, but that's the point of a top and the manipulation, except for most that frustration comes with heavy losses.

The Market Movers

like AAPL and GGOG have been selling off into the close, they are either within a fraction of negative on the day or they are negative. Look at the stocks on the list, they are falling apart-those are your trades.

A Look at Stocks...

We don't have a lot of time in the trading day. Obviously I'm onto something in looking at the weighting of an index to see what's happening, for instance, the index is up because the stocks with the most weight are up, but perhaps 4 stocks are down for every 1 that is up and the index appears and is up, but internally the market is not doing well. So I looked at the stocks I gave you last night-just price and volume action.

AAPL is declining on large volume, JNPR is reversing, large red volume is appearing, GOOG is headed down on large red volume and closing in on a support level, SNDK looks very bad, it's reversed, volume is heavy, ISRG has broken as ascending wedge to the downside, HPQ is in a lateral trend with a lot of volume-indicative of churning/distribution, others are flat with one in an uptrend, but the big leaders of the market don't look good. This is why I wanted to create that indicator.

The SPY has finally reversed, remember though I said it was likely trying to test the highs. Oops, it just put in a big candle up. So I'm going to keep checking around.

Afternoon Update


Above is the 1 min 3C chart. You can see the breakout was put on by the market makers and quickly sold off to trap longs entering the breakout and stopping them out around $111.30. The rest of the time they distributed into the advance.
Here's the 3C 5 min chart, we see the same overall distribution. In the Box we have a bearish candlestick pattern called "Falling 3 Methods" . To confirm the candlestick pattern we need price below the $111.38-$111.40 area-that will confirm the pattern. right now we are at $111.39 so a little more and I'd think some downside momentum will pick up. Certainly longs from the ascending triangle are starting to get worried. IF/When they become sellers, it will help move the market down.

I said earlier-either in a comment or email-sorry? that it looked like a retest of the highs, either from yesterday or all time highs for the bounce. If price continues down it will be very discouraging to bulls as the test will have failed.

SILVER-SLV

I had an email question about Silver, so I thought I'd share it with all. Market update is coming soon, but we have a 3C reversal signal.

Point A shows a clear long range channel SLV traded in and then an upside breakout. These are always suspicious to see extraordinary volatility in a stable trend, it turned out to be a false breakout, you can see the Judo Concept as it heads down-note the volume at each point as well. Point B we have a downside breakout, this is what you'd normally expect. Typically there is one more rally to the breakdown point and the issue falls, not in this case though, so another false breakout. Point "C" is the area I just mentioned-it's called "Kissing the trend goodbye". At point "D" a big triangle consolidation formed, usually when they are this big they function as tops or after a long downtrend, as bottoms. The volume fell in the pattern as it should and then it broke out on increasing volume-thus far bullish-that was point E.
This is a 15 min 3C of the breakout, there's accumulation right before it so smart money wanted this breakout, they then sold into higher prices at the red arrow.
Both long term 3C charts here, the blue is very long, show that smart money has been moving slowly out of the trade. They probably had a huge position and needed the upside breakout to create the demand needed to exit the rest of their position. Each 3C is written totally differently so I don't get the same results, I want confirmation and the general trend gives me that, but they will look differently as they count accumulation/distribution in different time intervals.
This hourly chart is a faster version then the rest, thus shows a blend of what happened. That's a difficult concept to understand, that smart money can be in short term accumulation for a breakout like this, while long term distributing shares, you have to understand that for the charts to make sense. But this shows the same thing, they supported the breakout and sold into it.

The verdict on Silver... It's selling off as well, not as long or intense as gold, but then again, Gold has a lot stronger bullish sentiment.

Another Lesson In Hard Knocks


Above we have an ascending triangle-not to be confused with an ascending wedge. The triangle is bullish, the wedge is bearish. In any case, it's pretty apparent on the SPY 1 min chart. The breakout came on increased volume (I'm not sure what the red spike was about) but this is a perfect- Technical Analysis textbook entry. It goes something like this, "let the market show you by price action-wait for the breakout". Most traders being a bit greedy will get in as soon as the formation is visible. The breakout is where the disciplined TA traders jump in. The stop, according to textbooks, goes right at the apex of the triangle, meaning a move below that you stop out. Well, whether or not this resolves to the upside or down, a bunch of traders who jumped in on the breakout just got taken out for a loss and the market maker on the other side of the trade made the gain.

The 1 minute 3C showed a trap in the making here.

As for how it plays out from here (the false breakout was a play of it's own), we'll have to wait, watch and see. Currently 3C has moved lower and would be around the $111.10 area on this chart.

Remember to review these charts, they are a wealth of information about how Wall Street works.

Thought this was interesting..

As you may know, in a recent comment today (see comments section of individual posts) I had written that I'll be working on an indicator that is a sort of advance decline line of stocks by their weight in the index. I went to look for that information and came across this on the NASDAQ website....


Apparently the information is available for a mere individual subscription of $10,000 a year. Does anyone find this simple question and the consequential answer to be biased toward Institutional money? After all, I don't know of any investors that can or would pay $10,000 just to find out which stocks carry which amount of weight in the index. I think this is crucial information to know if you'd like to find out if an index is being manipulated higher, especially when the majority of the component stocks are down for the day.

Another roadblock in the quest for market transparency.... If anyone finds this information, I'd appreciate an email. Oh and by the way, it can't be figured out using the market cap of the stocks (NASDAQ has a proprietary formula for weighting the index that changes frequently).

GOLD BUGS.....RAID!!!!

There has been tons of positive sentiment on Wall Street driving Gold higher in recent months, just like in 2007 at the height of the market, there was a lot of sentiment saying the DOW could run to 20k. I guess we'll coin a new phrase, "A Listing Boat" to refer to overwhelming retail sentiment. Remember that the media is either openly in on the Wall Street scam or their just too lazy to do anything but swallow the hook, line and sinker of their Wall Street sources. Cramer talked openly about manipulating the media to manipulate a stock's price, I think back then he referred directly to Bob Pissani from CNBC (SP?) and telling him that AT&T wasn't interested in the phone right before MAC-WORLD knowing that AAPL doesn't come out and refute press stories or comment on them.

In any case, the GLD boat is severely listing to one side and 3C is showing the institutional response to that. Take a look at the charts and consider GLD as it will appear on my September short list. It's in good position right now.


For those of you who haven't heard this video before, HERE IT IS. It used to be everywhere, now you can only find it here and I suspect Cramer wishes he didn't put this out and openly admits he's never say this on Mad Money-Aaron Task seems more then a little uncomfortable with how much detail Cramer goes into and seems to really be proud of his brilliance and relish in the moment. One of Cramer's most enlightening quotes is when he says, if you are a Hedge Fund manager and you are not willing to do this, you shouldn't be in the game. Cramer was a hedge fund manager and implicates himself, by implication of course and directly. Then he goes out on Mad Money and talks about being for the little guys and once in awhile berates short sellers. Hypocritical? You be the judge. Like I said, I bet he wishes he could take it back.

Of Last Night's 15 Ideas

10 are headed in the right direction and a few already at pretty significant gains.

JNPR, AAPL, SNDK, HPQ, CSCO, OVTI (-5.3% today), CAVM, ISRG, DECK, and the one long GOK (up 4.5% today).

The others are still looking good as well so I'd keep them on your radar. If you have specific questions about any of these trades, feel free to email me.

Market Update:

The Ascending Wedge from this morning's update I mentioned seems to be well on its way to retracing its base. That is just an initial target for the pattern itself. It is worth noting, if you care to look at the chart, around 11:33 there was a small head fake to the upside, it's in scale with the pattern. Again, these are the games Wall Street plays now. According to conventional technical analysis, the pattern should just break down, but we are seeing these obvious patterns with increasing frequency, put in a head fake which is all part of the Judo Concept. The head fake draws in the longs, thinking the bearish wedge has failed and soon they are at a loss as prices move lower. They start selling, increasing the supply side of the supply/demand dynamic and prices head lower.

By now it probably seems like a mainstream concept to you as I mention it so often, but I tell you, it is not. You are a group of a few people who understand this. This is the reason it keeps working.

3C is largely in-line with the sell-off with a couple of versions nearing leading negative divergences.

Part 2

Wholesale Inventories rose with this morning's report, it's a lagging indicator as inventories are for July and are being touted as businesses are showing confidence in the economy. During July we also saw a 10+% rally in the market, the atmosphere changes weekly, if not daily and I'd consider this report to be of little consequence. 

The Cafe my family owns put in their biggest order ever, they had to borrow space as it wouldn't all fit in the store, but it wasn't because of a huge increase in business. We are in south florida and specifically Boca Raton where a lot of people own a winter home, the summer here is dead. Sales drop significantly after Mother's Day, that's a Florida thing, however in Boca Raton where the snowbirds who can really afford two homes, the seasonal effect is even more exaggerated. So they (the family) went for deep discounts by ordering bulk which allowed items to be shipped bulk for much less money per product. I realize it's not the same thing, but the point is there can be all kinds of reasons for a build in wholesale inventories, not all of them are good.

This morning one of our benevolent wolves, George, sent me an interesting story that awoke Bill Cara in the middle of the night so he would put it to press. I don't agree with everything the guy says, but I do respect his opinions because he's kind of got one foot on each side of the game as he runs his own investment firm. I thought you might be interested in reading the story too.

The only argument I have with his viewpoint and traders that also write is that they still are using conventional analysis. He's probably more tied into the "why" things happen , actually he is, he has decades more experience, but we have an edge of seeing those things in action in the market way before technical analysis can act on it.

For instance, a new breakout high like yesterday, do you buy it? Most technicians would say yes, but we have the insight into the market that it's being sold by smart money so yesterday's breakout high, if you had bought it, would have left you with a loss. Just as the oil trade went down about two and a half weeks ago. A Bad report, the market sold off heavy, do you short it? Most technicians would say yes, there's cause and effect and no reason for oil to rally, but we saw the accumulation, bought at the lows and realized a quick gain as USO reversed up and we were able to buy near the lows. So I do respect his opinion, I just prefer our methodology and the things he's seeing in the market now like the Euro stress tests being a failure and the DB story you will read about, may have been the reason the smarties set up this bounce nearly two weeks ago now, they knew ahead of time and setting up a bounce would allow them to sell the bad news into strength. However, lets just get to the story and insights of a talented man....


Thanks again George and everyone else with their eyes and ears out there, when we all work together, we all benefit. And on that note, let me just remind you, for non-personal questions  or comments, you may want to use the comments link so all can read them.

*It looks like our morning ascending wedge is about to break, although one final head fake higher isn't out of the question.

Morning Report

Good morning,

I wanted to get this 3C chart out to you and then I'll follow up in the next post...

Here if you look at the bottom of the chart you can see the time. This is yesterday afternoon/this morning. As you can see, the market has formed another ascending wedge (bearish) like the one that broke down in the afternoon yesterday. 3C is following price up in a sort of confirmation, but it's lower relative to the last wedge, if it were truly confirming prices it would be higher, this is what is known as a relative divergence-because it's a measurement of 3C between two relative points. I'd imagine the wedge will break soon and at least retrace its base. This is still very early on in the day.