Wednesday, April 23, 2014

NFLX Charts

These are the charts that go along with the last post...

 MAKE NIO MISTAKE, I LOVE NFLX AS A LONG TERM CORE SHORT POSITION, IF ENTERED AT THE RIGHT PLACE. This 4 hour chart of NFLX is more than enough to tell me which way I want to be trading this when it comes to longer term trend positions, the entry however is very important in getting a good position started and as such, any near term upside can be used for that purpose.

This 30 min chart is a good summary of why I have liked NFLX as a shorter term long for an upside move, not necessarily a new high, but a tradable move.

 Recently the pullback signals have been clear such as this leading negative 5 min chart on the gap up.

However, as I posted near the end of day, NFLX looks like it is starting a reversal process from that gap pullback, I think it could come down a bit more and fill the gap as well as potentially put in a head fake move once a rounding bottom or some reversal process is a bit more mature, but I don't see that taking very long (it could be done in a day).

 This 3 min chart shows the same negative distribution on the gap up, but take a closer look at intraday activity on the same chart below...

We have lateral price movement which is the first thing needed for an upside reversal and we are starting to see movement in 3C on 1-3 min charts that is positive, I wouldn't consider NFLX for even a short term long trade until at least the 5 min chart has a positive divegrence, but again, that can happen in as little as a day.

We'll keep an eye on this one, it may be a fun little trade for a quick $

NFLX looks likely to put in a move to the upside soon

This may be a little choppy and shorter in character, although I'll try to post some charts because NFLX has been one that I have liked for an upside move most of the month.

I personally will wait for stronger confirmation before making any moves, things feel just choppy and transient, maybe noisy would be the best word, but noisy for a reason, not just random noise.


This is also why I've largely just stuck with the few positions opened for this move for now, I will be looking to back up the truck and load it up with full size trades, I just don't feel we are at that spot yet as I said about this time yesterday.

Charts coming...

Index Futures

Intraday Index Futures are showing a bit more strength building, especially in NASDAQ and Russell 2000 futures, to a lesser degree in SPX futures.

Really not much has changed from yesterday's EOD opinion, I think there could still be an attempt to hit the pivot high targets that the NDX and R2K missed, but there's not much beyond that, thus I'm leaving the 3 short trading positions (QQQ May puts, VXX May Calls and SRTY long) in place, however I'd like to add to those in a bigger way, I just have felt since yesterday that we'd get some downside action, but not the specific move we are looking for yet with those targets still open.

I'd have to say that overall, today was a lot of what I'd call noise, there's nothing really to do as far as trades unless you are a very short term day trader and even then it's not a great environment, but the moves are being made to shake things up, to get some movement in the market, we don't need to react to that kind of stuff, just where and when the edges/probabilities appear.


 This is the 1 min NASDAQ futures chart mentioned above, but it's not really all that impressive as nothing has reached a 5 min chart...

/NQ / NASDAQ 100 Futures 5 min overall negative.

If there's something going on today, as I said I think it's moves that create movement among traders and that's why I said I thought the triangles were not random, but deliberate.

I'd be looking for a Crazy Ivan shakeout, a triangle is a perfect price pattern to use a Crazy Ivan because the movement from long to short or stop outs is so minute, it's basically whether price is above or below the apex of the triangle which is a very narrow range.
Technical Traders see this triangle and expect a break lower to start the next leg, a Crazy Ivan shakes out both longs and shorts by moving above and below the price or technical pattern that traders are concentrating on, the triangle in this instance.

The Crazy Ivan would be the yellow arrows, a move to suck in shorts and then stop them out as price moves above the apex and brings in longs, then price fails and the longs are taken out as well creating extra downside momentum as their selling provides more supply than demand can suck up.

We will see shortly, but right now is a time for patience and let the market tell us when and where to take additional action, this is not a time to try to force a trade. The overall bias is still bearish, but those targets do remain unfulfilled.


QUICK CHECK OF LEADING INDICATORS

Didn't reveal much, except there's a slightly stronger bias VERY short term to LI's vs the SPX.

In particular, Sentiment Indicators looked stronger than I'd expect, Credit wasn't much of an issue either way.

Intraday indications (3C for the averages) on 1 min charts have been blah about showing much positive, but there are still 3-5 min positives from earlier today that were never taken out and are still in effect.

Probably the most moving indication recently has been the NYSE intraday TICK.

This has been VERY blah all day in a range of +/- 750, that's really mellow, but this most recent turn in the NYSE TICK is much more bullish.

I'm still not moving any positions around or entering anything without a clear picture of an edge short term.

Market Update

I needed the last post out so you know what I'm looking for and why. A head fake has to be proven, in this case a head fake break of support on a bearish triangle would need to show accumulation in to lower prices, that hasn't happened yet, I say yet because the triangles were so precise, clean and textbook, they looked like they were purposefully put there and there's only one reason to do that, but again, we need objective evidence before making assumptions.

Otherwise the short positions added for this move should just be allowed to work.

Here's what I have so far...
 The 1 min intraday SPY would be the first place we see any new divergences like a positive divergence making it probable that the move below the triangles is a head fake, but we don't have anything like that yet, in fact just the opposite, a deeper leading negative. The market does move fast, especially on moves to the downside so I may have to put out some updates that are text only.


 as of this capture, the 2 min SPY was still in line, not positive, but in a leading negative overall position if zoomed out to proportion.

 The SPY 5 min looks the same as earlier, the 1 min negative would need to turn the 2 min chart, then3 min, etc (migration of the divergence) before it hits the 5 min so nothing unusual here.

The IWM 1 min is also leading negative  in a larger context.

 intraday it's about in line with price or confirmation.

The IWM 5 min chart "could" still post a relative positive divegrence within the deeper leading negative, but the intraday 1, 2, 3 min charts would need to start going positive.

 This is the QQQ 1 min, that's a deep leading negative that WAS NOT there earlier

 The 3 min chart still has a relative positive, but that's a matter of migration/time.

And the 15 min QQQ, I just wanted to show that this could simply be the reversal process to the downside as we had the head fake move yesterday that formed the chimney and what we see today would be a normal looking reversal process.

As I said, for now I'm just letting the short positions that were opened for this particular move work and looking for opportunities.

Watching for Triangle Head Fake

*** I thought this published around 1:50, but apparently not.  I need to get this out before the next post.

This triangle has been there most of the morning and afternoon in most of the averages, it's a symmetrical triangle in most cases like the SPY below...
 This is a symmetrical triangle in the SPY, it has no inherent bias on its own, it's a consolidation/continuation pattern so the preceding trend determines whether it's a bullish or bearish triangle, being the preceding trend was down, this would be expected to break to the downside and start the next leg lower according to technical analysis, this is where technical analysis is used against traders, head fake moves which we may see and in some cases be able to use for either profit taking or short term trade entries.

Before I could get this post started the break already occurred.

Note that even volume looks like a textbook triangle. Remember the SPY and DIA both hit the second upper target we had set and did so yesterday, that doesn't mean they can't move more, but they did hit that area whereas the QQQ and IWM did not.

The QQQ triangle is a bearish triangle, Descending triangle...
This is today's QQQ descending triangle that carries a bearish implication with it and should follow a downtrend as a consolidation/continuation pattern, these are the kinds of price patterns that retail technical traders will short as the break below support of the triangle represents price confirmation, thus they make for easy head fake set ups, but we need to see 3C evidence of that before we call that out, it would be helpful in giving the market upside momentum if it were to try for the remaining upside targets as a mini short squeeze would take hold.

I'll let you know what the 3C signals are as the move develops a little more, we need to see some decent volume to know that the ploy worked.

VIX Futures & Short Term Futures Update

I'm not just updating the VIX futures (incl. VXX) because of open positions, but because they are another piece of the market puzzle and there are things going on there that fit with near term and longer term expectations, specifically for VXX we've been looking for a larger foot-print base and the "Flying Leading Positive Divergences" that only VXX and UVXY seem to be able to create (very extreme, near vertical divergences, likely because they are an asset based on fear and fear is the strongest market emotion, thus the most intense signals).

Here are the charts for VXX (Short term VIX Futures) and confirmation charts added in with UVXY (the 2x leveraged version of VXX).

 2 min There's a very good chance we get a head fake move like we saw in the broad market yesterday, except in this instance it would look like an upside down "Igloo with chimney", the chimney being the head fake move, especially if the market makes the move to take out the pivot highs half of the averages missed yesterday.

 3 min leading in a reversal pattern.

5 min leading positive, note the increased activity just the last day or so as if Wall St. knew where the target area was, which they essentially would. Remember because of the size they trade in, it takes them longer to put a position together, thus the reversal process.

 This is a VERY clean flying leading divergence on a 10 min chart, these are the kinds of signals I'm looking for. This can get much more extreme with VXX/UVXY, we've seen it right before significant turns to the downside.

Look at that leading 15 min!

This is an hourly, because VXX is a rolling long position of the first and second month a cumulative indicator isn't used in the same manner, but we can compare what the urgency back a month or so vs. now and it looks like a large leading positive position right now even though there was a positive that started a small launch to the upside in March.

Actual VIX Futures...
 This is what I'm very interested in, these flat, tight ranges, these are where we see the most underlying movement although you'd never know it by price alone, but look at the divergence.

This is a 30 min version, again, a lot of leading positive action in a very small, condensed trading range.

Market Update

Today is very much like the general gut feeling I had yesterday which was summed up in the EOD Update...

I decided to just leave positions that have already been put in place such as: VXX calls, QQQ puts and an SRTY long, remain in place without subtracting from them and without adding to them....

While the SPX and Dow did make that higher high AFTER they broke below support to stage 4 (thereby shaking out new "confirmation" shorts), the NASDAQ 100 and Russell 2000 failed to do so...

It does look like a move to the downside is ready to break, however I'm not ready to load up the back of the truck until I see the same sort of 3C extremes in the broad market....

The 30 min chart still shows the positive divergence in what I was calling a head faked "W" base, but the negative divegrence isn't there yet, that doesn't mean the market can't or won't move lower from here, in fact it looks pretty likely that it does, but this is unresolved. Perhaps tomorrow this falls apart badly and then we'll decide how to react, but until then I'm weary that we may have a pullback that is a worthwhile trade, but not the one we are looking for.

This morning I talked about "pray for a bounce", of course that would take some lateral movement, the market rarely just turns on a dime and creates a sharp "V" reversal, that's what it appears we are seeing now which is still fine and I mean "fine" from a bearish, short perspective (if there's a bounce worth trading I'll mention that too).

 SPY 2 min chart with some intraday positive 3C action as a lateral zone is being formed,  as I said yesterday, "A Move down, but NOT the one we're looking for"...yet.


 The SPY 3 min in perspective from yesterday's head fake/distributive move...

The exact same 3 min SPY chart zoomed to intraday , this is basically in line, it's not really a positive divegrence.

 This is the 5 min IWM as a small positive divegrence has migrated out as far as the 5 min chart, it is still within a deeper and larger leading negative, but this looks to be the intraday action I mentioned earlier, "Pray for a bounce".

 This is the same 5 min IWM chart zoomed in to intraday so as you see, it's also not really a positive divegrence, more in line than anything.

The QQQ 5 min

And the QQQ 5 min zoomed in to intraday, this is slightly more positive with a small leading component. The point is the price action (generally speaking) I expected yesterday (for today) and what I saw this morning seems to be taking some shape, this in my view is a good thing, those targets were left unresolved and I'd much rather see a bounce with very weak underlying trade as we are seeing form right now than something with strong underlying trade, but based on the distributive nature of yesterday, I didn't really expect to see anything strong.

I'm going to be patient here and continue to poke around a bit more, the Options that are open (QQQ Puts and VXX calls are May monthly expiration so I'm not concerned about them).

NASDAQ Biotech Index Update

The NDX Biotech Index won the media's bear market award with the prerequisite -20% or more decline; in all actuality a bear market is decided by trends not a particular threshold of something like 20% which is very arbitrary and holds little meaning between a high beta and low beta asset, this is why Dow Theory has trend classifications to determine the market trend.

In any case, being down as much as it was after being up as much as it was has generated some interest. My first look at the NASDAQ Biotech (IBB) was on April 10th NASDAQ Biotech Index- IBB . I found the asset interesting for a number of reasons and since the April 10th post, many of the things the charts were showing as higher probability have come to pass or are right there now.

There are two potential trades in IBB or the leveraged versions (BIB long or BIS short); one would be a H&S volatility shakeout of new shorts as there's a H&S price pattern in place that has seen the neckline broken. The stronger trade in my opinion is IBB short at the top of the shakeout, this is the 3rd and last place I'll short any H&S top. Lets check the charts, as far as a possible long trade for a shakeout move, if the charts support that option to a degree in which it looks very high probability then it's something worth considering, if not, then I'd try to wait for the short set up which is really the highest probability play for a longer term position trade.

 This daily chart of IBB shows the stages and the Left Shoulder, Head and Right Shoulder of the H&S top with the break below the neckline and a move that is VERY close to a shakeout of new shorts which would be above the neckline, it would be at the end of such a move above the neckline where we'd look for the longer term trending short as that would be a better entry with much less risk.


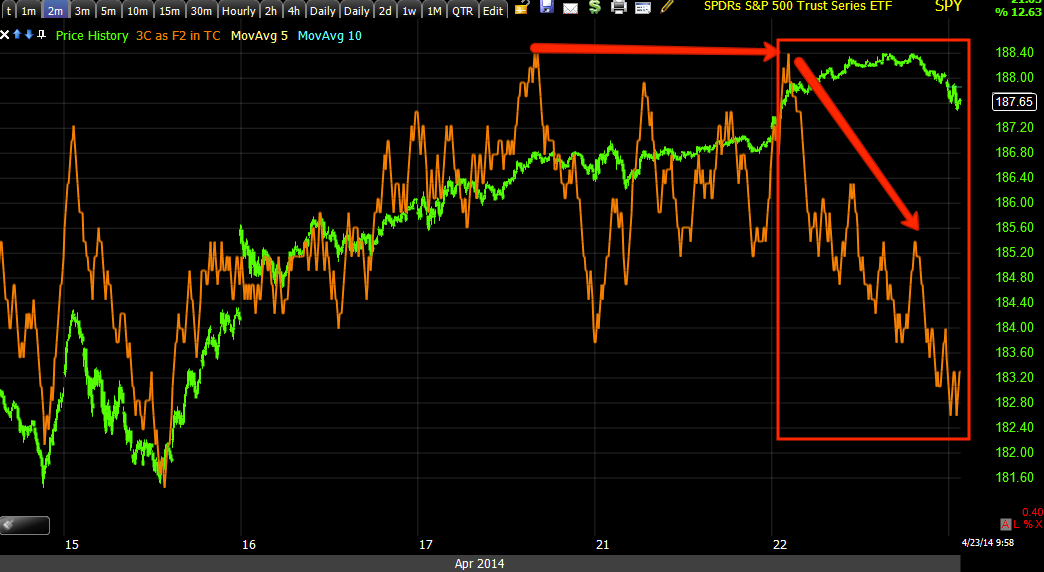
 The 15 min chart is probably one of the best cases for a bounce in IBB, quite a few of you have been interested in the position, I have urged some patience as the signals and resistance in the area didn't look like an ideal long entry.

 This is a closer look at the 15 min chart and the recent resistance that was hit which also pairs up pretty well with the H&S's neckline resistance, thus it was turned back yesterday with the rest of the market.

 Short term this is why I was urging patience on any possible long trades for a move above the neckline, I also told most of you that the general market updates should largely apply to IBB as well, especially the QQQ updates, they may not be perfect, but they'll be very close.

 2 min chart backing off as well at resistance, this is often where retail traders will enter a larger short or wait for (what appears to be) a failed test of resistance at the neckline to enter their first short.

 3 min chart... very much like the broader market...

5 min chart

and the 10 min chart.

So as you can see, at this time, I don't see a reasonable long entry for a volatility shakeout move, it may come, it may not, usually they do, but I don't see a good reason right now to be long for a bounce/head fake move.

I do see a lot of reasons to be short this one for a longer term trending trade as it should enter a primary bear trend, but again I'd rather be patient and see if we get the typical entry above the neckline and right in the area of the right shoulder.

Opening Indications...Pray for a little bounce....

Our local surf shop's wave report always says, "Pray for waves", living in South Florida, that's about all you can do as the Bahamas blocks 90% of the swell. In any case, looking at the market this morning that's the first thing I thought of, "Pray for a little bounce, maybe intraday...

Yesterday in the End of Day Report EOD Update I started it with,

"As far as 3C signals, today they were as you'd expect for a head fake move which would just be a run above the rounding top that was already in place, the head fake move itself occurs about 80+% of the time before a reversal in any timeframe, whether you are looking at 15 min charts, 5 day charts or intraday 1 min charts. The head fake move is one of the better timing signals we have when we already know there's an underlying trend of distribution or accumulation."

Looking at the SPY charts, it's amazing how clean the signals for a head fake move yesterday were. You may recall that I decided to leave what was already established for a move down in place rather than add to it at this time because some targets on the upside had not been taken out. Looking at the charts all I can think of if, "please give us a little bounce" because with that I believe we will have a larger opportunity to play the downside move in greater size with the charts and objective data to back up that kind of decision, perhaps a bounce to the targets I talked about that were missed in a couple of the averages yesterday. From certain charts, it looks like that "may" be a possibility, lets just get to the charts so you can see for yourself.

 SPY 1 min at yesterday's head fake, a very clean divergence that is leading negative

SPY 2 min, there's the migration of the divergence we were missing Monday.

SPY 3 min, very nice leading negative, but here's where it gets more interesting...

look at the leading negative on that 5 min chart, that's like pure, uninterrupted, large scale distribution.

 The 10 min chart is doing the exact same thing, just not as deep yet because of the concept of migration of a divergence.

 The 15 min chart is negative enough that just adding a bit more and/or knocking the 30 min out of kine would be justification enough for me to enter in larger size on the short side.

Remember the 60 min chart is already trashed, there was no positive out to that time frame so it's just the 30 min.

The QQQ and IWM look the same, although I won't post all of the charts...
 QQQ 15 min

IWM 15 min...


And why might we get a little bounce?
 This is the QQQ 1 min with a small intraday positive, that could be the little bounce that allows us to add in size.

Here the IWM 2 min has the same, both IWM and QQQ have 1 and 2 min small positives like this, they stop there, they don't reach the 3 min chart so a little bounce looks probable and would be VERY useful.

I'm not saying the 3 min or longer won't go positive, just that they are not now, the important thing is the 5, 10 and 15 min charts and how bad they look and how quickly that happened.

I'll keep you up to speed, for now I'm not making any changes in positions.