Tuesday, August 14, 2012

BPZ Update

I was asked about a stock we got long around the $2.30-$2.32, it's an energy stock and that's what raised the question.

This is one stock, other than UNG, that I do like long and have just been patient with it. Today BPZ put in a nice 11+% gain putting the equity position at an 8% gain, but as mentioned, I like this for the longer haul and I don't have any intensions of trying to trade around it as it bases, which is why I chose a non-leveraged position in the equity model portfolio rather than an options position.

Here's the update and why I feel fine just sticking it out with BPZ.

 First, this isn't a stock in a position of topping, it's in a position of a stage 1 base, volume and price both confirm that in my view so I'm not worried about a big decline of a stock that is under accumulation.

 The 2 min chart shows a positive divergence yesterday just before BPZ shot up today.

 The 15 min chart shows negative divergences that send price down where it is accumulated, each positive divergence is getting bigger and now we have our first leading positive divergence on this timeframe.

 The 60 min chart also shows a leading positive divergence where the base is being formed, this is a very important timeframe and suggests heavy activity, note the negative divergence before the base and the head fake move in the yellow box above resistance just before the reversal to the downside (around April).


 An even more important timeframe, the 4 hour is also leading positive.

Finally, to see a leading positive divergence form so quickly on a DAILY chart is VERY impressive, this is why I have no interest in trying to trade around this position and possibly miss a series of days like today, even though we had some good notice yesterday. For now, I'll stick it out with BPZ which is about 2/3rds the size of a normal position, larger than a speculative position.

IOC Update

IOC is a position we have had to be patient with, some of you entered recently on some recent updates and probably have a decent profit. I opened a core short position in the equities model portfolio which I'm going to have to re-evaluate as I have core shorts in XOM, IOC and a position in USO which is a lot of exposure to energy in an already highly correlated market.

I also opened a position in the options model portfolio, a Sept. $95 put.

We have a member who has stuck it out with this trade, put his faith in 3C that IOC would turn and when it does his broker closes the position on him because they can no longer borrow the shares! I've had this happen a few times with the same broker (which will go nameless), if this happens to you I encourage you to call the district office (if your broker has one-it's always good to have a good relationship with someone at a district office-I had my commissions cut by 20% because of the relationship and because I asked), make some noise and tell them you want them to call other brokers and see if they can borrow the shares. Most of the time they can't borrow them and that's why they closed it, but if you have a good relationship with someone at the office, I've had them go the extra inch and find the shares for me, I was also making between 100 and 200 trades a week back then too.

Here's the IOC Update, as for USO, I'll wait for the EIA inventory report tomorrow morning and see if it gives me an opportunity to look at adding to USO if that's the direction I go in.

 IOC daily broke above a recent resistance zone, created the pivot last Wednesday and didn't do anything else since to confirm the break out-no follow through. Yesterday was a nice close as far as candlestick charting goes, a nice confirmation day and below the support area. Today IOC seemed to be lingering around a near term support area at the red arrow, it may be because of the EIA report tomorrow or just the typical loitering we see when important resistance/support is broken. I'm not crazy about the Doji candle close today on higher volume, you know why as I have shown this to you about 6 times today. I'll feel better with IOC under the next support area and I think it will get there, however in deciding which energy position to stick with, opportunity cost will be a factor.

 Here's the 60 min chat and the support I mentioned, notice IOC spent the whole day in the area shaking the tree of stops/orders.

 As for my Demark-inspired custom indicator on a5 day setting, we have a sell signal, only the 3rd real signal on the chart in t he last 3+ years.

 The 15 min chart was already in a bad place strategically, the last several weeks have shows a very nasty divergence that is more tactical. This is one of the reasons I treat and consider IOC as a head fake/false breakout trade.

 As IOC moved above the resistance area, look at the leading negative divergence/Distribution in to that move (yellow on price/red on 3C). In addition to the closing candle there's a 3 min positive divergence that I wouldn't normally pay any attention to if the daily candle hadn't closed as it did. Still I view this as noise/volatility if we do see an upside move off today's 3.81% decline and yesterday's 4.36%% decline, it wouldn't be unusual to see a relief move to clear out some shorts.

 The 1 min chart is in line with price so it may still migrate to the 3 min chart.

 As for shorter term moves as in "since the June lows", the daily Trend Channel has held the move, it did give a sell signal/short signal today with the close below the channel.

On a longer term basis as a core short, I want to see IOC close below the 2 day trend channel.

ES Update

As mentioned just a bit ago, the small intraday divergence that tried to form, but was most likely just holding a consolidation together has completely failed. Don't underestimate what it means to lose support from Energy, Financials and Tech, each took their turn moving the market and getting it in to position, but none saw ANY improvement, no confirmation even.

As another tool you can use, the TICK chart is useful, it showed a problem before price did and it is especially useful if you draw trendlines around it and wait for a break of those trends, they often precede reversals.


 Here's the initial 1 min ES positive divergence, as mentioned sometimes the presence of this support is used to keep a market sideways and without it, the market would otherwise fall, who knows why some extra time may have been needed, possibly to wrap up some positioning. It may not seem like much, but as I have told you, it happens on EVERY timeframe and we see it about 80% of the time just before a reversal, at the vertical red arrow ES makes a 5+ min move above a trading range that had been in place for several hours. It's the little things, it's the things the crowd missed that often count the most.

ES and its VWAP, selling at the top of the standard deviation channel is ideal, selling at VWAP is standard and the way institutional order fills are measured. A move below the standard deviation of VWAP is extreme, especially in ES.

The NYSE TICK has hit lower than -1300.


The 3 Pillars

Technology, Energy, and Financials, without support from all 3 of these sectors, I have never seen a rally been able to sustain itself. Sure there's rotation in certain markets, but recently the markets have been highly correlated, this isn't really what you'd call a stock-pickers market, it's a market in which you have to know what the right tools are to deal with the volatility, be patient and wait for the highest probability set ups and then be ready to make adjustments on the fly. It's certainly not a systems trading market.

Here's what the 3 (in my opinion) most important of the 10 major sectors look like and to me, it looks like all 3 legs have been knocked out.

Energy
 Remember that August 2nd saw market wide accumulation, this wasn't by chance. 2 min Energy

 3 min Energy hitting a new leading negative low today

 5 min Energy (the red box is a leading negative divergence, this is worse or more powerful than a relative divergence represented by an arrow).

 Energy 15 min with a pretty strong leading negative move today alone.

Financials
 1 min hitting a new leading negative low as Financials try to make that pivot.

 2 min Financials moving to a new leading negative low

 longer view of the 2 min trend in Financials, note Aug 2nd.

 Financials 5 min leading negative

 15 min in a leading negative position

Technology
 A lot of intraday damage being done today, the red box is today only at a new leading low below the 2nd of Aug.

 5 min seeing a lot of damage today as well, red box is today only.

 15 min chart hitting a new leading negative low, almost back at the June lows, this is bad.

30 min is in a deep leading negative divergence

NYSE TICK INDEX UGLY

We are seeing readings since 3 p.m. at -1000. There are a lot more stocks selling off than ticking up.

Still Liking AAPL Short Here

 There were and are a lot of technical patterns in AAPL that all add up to AAPL being where it is right now (as far as reversals and bull traps that feed reversals go), but it can be simplified with one simple trendline and the concept of creating retail technical demand to sell short in to, a break above the resistance highs.

 The 3 min chart and accumulation that was needed to get AAPL above the bull flag from yesterday talked about at length both yesterday and Friday, the chart is breaking down which puts the intraday charts in line with the longer term strategic charts.

The 5 min chart's trend, this is the concept of a large position in an expensive stock like AAPL taking time to distribute or sell short in large quantity, lots in the millions rather than the 100's.

Still, the most interesting thing on the chart today may be the first chart, the daily above showing today's candlestick rejecting higher prices with a longer upper wick.

Thus if I had room to add to AAPL here, I would.

Quick Market Update

The last market update re: DIA/QQQ 1-2 min positive divergences is now starting to look sloppy, the DIA /QQQ intraday timeframes that were positive are showing weakness now, the easiest, fastest way to demonstrate is with ES which was also showing a 1 min intraday positive.

The ES positive is now getting sloppy. It's not very often, but we have seen occasionally a 1-2 min divergence, whether positive or negative not create an intraday move, but rather an intraday consolidation of sideways movement. Without the divergence price would likely move lower (in this situation) but instead holds in a range.

We'll see what comes of it, but we do have a nice pivot as I pointed out last night as being the one thing missing from the major averages, this is the chart from last night...
Here are the pivots pointed out last night, note the lack of a pivot as of last night.

Today...


UNG Update

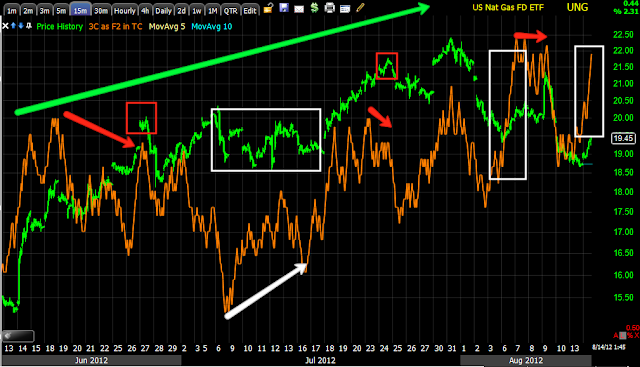
If you don't know, UNG is one of my ONLY long term long positions I like and it is the only Core long in the equities model portfolio. UNG showed us a change of character a while ago, although price kept heading down in to positive divergences, if you had bought around the area where we first spotted positive divergences and added on subsequent divergences at lower prices, you should be in the green in UNG.

However, a 20% gain is not why I like UNG, I think this has the potential of putting in a lot more than that or I wouldn't include it as a core long position.

There are a few concepts in this post that I will show you or enforce and there's  bullish looking activity now.

 The daily chart shows the concept of a bearish or bullish candle with a volume spike acting as a short term reversal, on the first one the next day we saw a -7.58% decline, the second one (a bearish Shooting star candle) with increased volume led to a 4.42% decline the next day and only lasted 2 days like the previous candle. So again we have sen this concept today on intraday charts and now here it is on a daily, as I said, it works on all timeframes.

Otherwise, UNG is looking like it will run above resistance, it just needs a bullish day with volume to jump start a stage 2 mark up where it should start trending up well.

 As a long term position, I'm using a 3-day Trend Channel stop which held the entire downtrend and stopped it out at the small red arrow and then went long and has held that entire move, thus far over 26%.

 Using the 3 day X-Over Screen to prevent false moving average cross-over signals shows where UNG was a solid long on 3 signals; it also shows the pullback to the blue moving average which is a typical area this far in to the move.


 The 1 min chart went berserk at the flat range and headed up from there.

 Intraday it looks like it may be a little overdone and seems to be seeing some profit taking, but a 1 min divergence can also be just enough to create a consolidation as we see in yellow.

 The 3 min chart is also showing a huge leading positive divergence at the same flat area in price.

 And the 5 min saw migration from those timeframes with a relative and then leading positive divergence. If I wanted to start or add to UNG, I would consider this a good area, although any intraday price weakness would be even better.

 I marked several 15 min divergences, but the overall trend in 3C has been of confirmation (green)

Here's the 4 hour chart, the big picture showing downside confirmation to a huge set of leading positive divergences. UNG has established a base that is large enough to support a solid uptrend.


Intraday swing

The DIA and QQQ are showing intraday 1-2 min positive divergences, the SPY is definitely NOT, the IWM also is not with the SPY looking the worst. There's also a slight positive on ES 1 min, watch for some upside volatility, I'm not sure if it will be market wide given the SPY is totally not cooperating.

More on the predictability of traders...

I'm not posting this as an interesting aside, I'm posting it so you can see how predictable traders are and given some simple Book information on where stops that are left with brokers or orders that are left with brokers, it makes the game like shooting fish in a barrel for Wall Street or anyone else who has made some modest discoveries by paying attention.

My hope is that you will be able to use this in your analysis and understanding of the market.

That same 50 bar, 5 min moving average in AAPL used since the 1990's when everyone was a day trader. Wall Street can easily use this to set traders' expectations who follow this ma, and can use it to suck them in or knock them out of positions, it's not hard at all for a market maker to move the market a little intraday working the bid/ask and either pulling in or letting out some of their inventory. In fact I wouldn't be surprised if some algos/HFTs programs used this very predictable "Tool" (sarc.) to trade.

AAPL Update

Here's an AAPL update, but don't forget the past data that is not reflected in this post such as the expected move yesterday above the bull triangle and why that is important to a reversal and the parabolic move this morning, not only in AAPL, but GOOG as well which is still racking up the green on the positions entered today, puts are up almost 14% in a few hours.

Here are the charts for AAPL...
 There were stops tripped, the volume doesn't look hug to the right, but any changes in volume however subtle, if they change the character of trade, they are important; this is where so many traders go wrong when they run volume scans looking for 10x surges thinking it's institutional money accumulating or distributing. As long time members know, by the time we see volume spikes like that, smart money has long ago entered, exited or shorted the position-THEY DO NOT LAY THEIR CARD ON THE TABLE UNLESS THEY WANT YOU TO SEE THEM.

Here we have former resistance, it became support on a consolidation, AAPL ran up, it held as support at least 4 times and as usual, traders placed stops right at the EXACT level where anyone can see, but even easier, guess that they are there.

 Here's the same level, just a close up of the break below support and stops triggered, but that's not the only stop system traders use...

 This is from the old days when day trading ruled, a 50 bar moving average on a 5 min chart as a stop, unreal they still use this. The volume and candlestick created on this move are short term/intraday bullish at least for a reversal (there is not target for the reversal, it can last 10 mins or days-it's just a reversal signal) and this concept works on ALL timeframes. 

 AAPL 1 min chart is the fastest so I wanted to see if there was accumulation at that candlestick reversal above, in yellow you can see there is not, the overall leading divergence is impressive compared to the size of the divergence that turned AAPL at its highs today.

 Here's the accumulation from Friday for the move above the triangle we expected yesterday. There's 1 possible relative positive divergence where we are from the recent intraday lows, as yo know these aren't very strong. If anything at all, I would think AAPL at this point is more likely to float directionally with the overall market; I think the cycle in AAPL is over.


 The 3 min chart leading negative from a relative negative divergence first and no sign of a positive divergence at the yellow box.

Actually I see as I'm writing this, it no longer matters as AAPL just made a new lower low.

The 5 min intraday, you may recall what the 5 min trend looked like, straight down.