I got a little kick out of something I read on another site. As you know, the Dow has closed up 21 of 21 consecutive Tuesday's, this site said today's ramp in the market which retraced half of the decline from Friday, was front running the Tuesday effect.
Honestly, Friday as you can see by the posts both Friday and last night, there was clearly something going on that had me convinced enough that this wasn't the final break in the market that I opened several call positions, not equity or even 2-3x leveraged long ETFs, but calls-full on leverage. If something as simple as front running Tuesday is all today was about, then why was today's gain telegraphed in the market last Friday?
If anything, with a break in the market and action like that, you expect a confirmation, follow through day on the downside, but today we closed up as much as +.90% in the Dow 30 with the NDX up +.70 and the SPX up +.59%, these are bigger moves than we were seeing during the "Bull" phase of the market.
People want a simple explanation for why the market did what it did, they want to feel like they understand, you've seen how many different assets we track just to get a feel for what's going on, the market can rarely be summed up in a sentence and a lot of the time we can see what's happening below the surface like last Friday, but we don't know exactly why. I guess it's part of that human need for control in the midst of chaos.
In any case, does the Dow make it 22 of 22 consecutive green Tuesday's or does the Pavlovian conditioning get turned upside down and drop the hammer on unsuspecting 1-day bulls?
In any case, this market feels so close, I'm looking forward to closing calls and short term long trades and just building shorts where there's good , high probability set ups and kind of just being patient, it's feeling a little too close to the edge of the cliff for me.
In fact, I see a few things that make me wonder if we aren't 24 to 48 hours from a very nasty surprise.
Even as we saw on today's reversal, there's no significant reversal on any timeframe as the market is fractal in nature because humans always act the same; I can't imagine the market dumping without a decent head fake and that means above the triangle that the SPX broke under Friday- the one we are very close to testing or what use to be the "Kiss goodbye" before Wall St. started using Technical Analysis' predictability against its practitioners.
I'm going to throw some charts out there. First thing I noticed was almost all of the ETFs had significantly more volume today than Friday, while the market averages themselves had significantly more volume on Friday than today. That makes me wonder if smart money is riding along as we are on a little coast to the upside, but are using simple ETFs rather than getting involved in a bunch of stocks.
There were some interesting candlestick reversal pairs today as well.
The DIA looks different than the Dow, but I always prefer the ETFs over the averages in most cases as they show the sentiment in the market better than the averages for a variety of reasons.
Note the Harami or inside day over the last 2 days, also the increased volume tends to make these candlestick formations about 50% more reliable, so we have an upside reversal signal in the DIA today, which fits well with making a head fake move above the SPX/SPY's triangle which is still a good bit above
and don't forget the most important part of any good head fake move, that it change sentiment and touch emotions-both fear and greed (shorts scared and cover, greedy longs afraid they'll be left behind).
No matter how many times I warn that this is the purpose of these moves, a lot of us still get caught in that emotional whirlpool and miss the chance to use it to your advantage. Generally speaking, doing the opposite of what your emotions tell you is typically a pretty safe bet in "normal " market conditions-meaning ones in which the market isn't being flooded with freshly printed dollars.
In any case, if we are lucky enough to get a move that strong, it's a gift, I'd be using it.
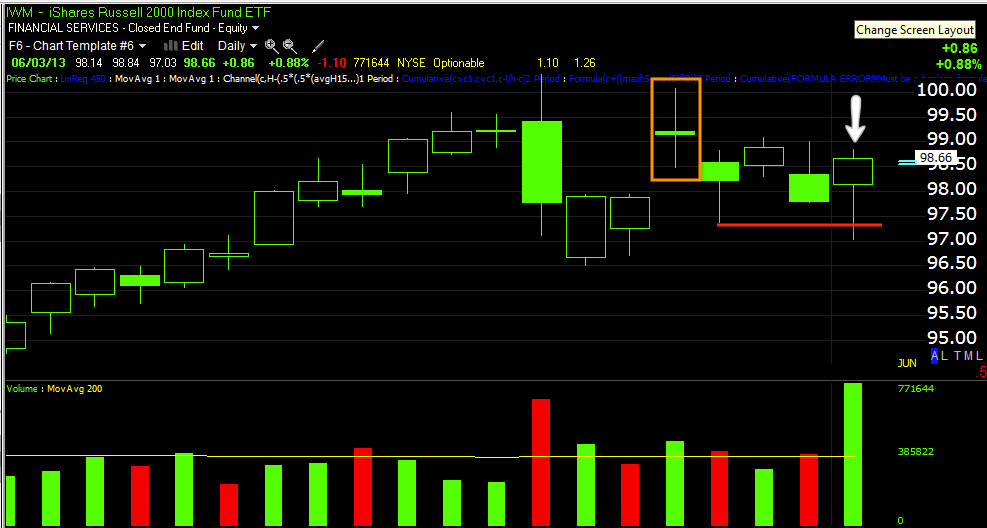
The IWM with what is almost a spinning top in orange (bearish downside reversal) and a long, beautiful bullish hammer on increased volume today.
The QQQ with not only a Harami reversal (inside day) today, but a long, beautiful bullish hammer on increased volume.
*Note the head fake move in which support of the previous "Tweezer bottom" is pierced today before the IWM closes near the top of today's range. You can't ask for a better looking hammer than that and it's part of a bullish Harami as well.
The SPX also formed a Harami today, the SPY's is clearer and is also a Hammer like the IWM. We also see 50% of the move from Friday's highs to today's lows retraced today.
Now take a look at the VIX which typically trades opposite the market.
The Bollinger band squeeze we saw a couple of weeks ago worked just as it should have, I doubt it's over, but for now, we have a shooting star today which is also a bearish Harami as its inside Friday's body, that's two downside reversal signals today in the VIX that confirm all of the averages above.
I just wonder if we can get a move strong enough tomorrow to also end tomorrow and the only reason I mention it is because the Dominant Price/Volume Relationship among all of the component stocks of all the major averages was heavily skewed to Close Up/Volume down which is the most bearish of the 4 relationships, but it also is often taken as a sign that the next day will close down, I know it's pretty hard to come up with any other relationship with Friday's volume, but it still makes me wonder if we put in what would look almost exactly like the VIX's candle today, a bearish Shooting Star?
As far as candlestick patterns go and volume in the ETFs, they are looking very strong for a continued upside reversal tomorrow, but not all is well, in fact far from it.
Lets look at today's Leading Indicators because I want to remind you of just how much trouble this market is in.
*Remember Leading Indicators are always compared to the SPX in green unless otherwise noted.
Here commodities almost act the opposite of stocks, I'll show you why.
Just as we have seen with the market since the $USD broke out of it's large base, commodities too are now showing more respect for the $USD correlation, here I replaced the SPX with the $USD in green, they are trading opposite as they should' the market however is ignoring that correlation because the more important one is the USD/JPY, that means the market has to trade with the $USD.
Risk sentiment measured by HIO fell off as the market gained ground today, FCT was even worse.
High Yield Corp. Credit (HYG) is not only important because it leads stocks, but in this case, it's a major arbitrage component for the algos to follow, they assume smart money is buying credit, then they should be buying stocks.
This is the 4 hour chart of HYG credit, in case we do get an emotional move to the upside and you start to get worried about your shorts, just come back and look at this chart-"
Credit leads, equities follow" and HYG is leading to a new low for the year, this is the largest Credit/Equity dislocation I've ever seen.
High Yield Credit didn't want to follow the SPX higher in to the close, in this case because it's so illiquid, I don't blame them for not bidding up HY credit, it would be real hard to get out fast with a large position.
Furthermore, the first dip earlier in the year made the lowest low of the year, the most recent one is even lower, this is lower than a lot of the action back in to 2012, this is another reminder of which way this market is going,
this market truly is the deadest market walking I've ever seen.
Short term VIX futures (VXX) is another algo SPY correlation, when it sells off it tells algos that traders aren't worried about protection, therefore buy stocks, that's why these 3 assets are manipulated so often intraday (the 3rd being TLT/Treasuries in which the exact same holds true).
Just a little longer term, look at how much more the VXX was bid vs what the SPX lost, that's traders reaching for protection, actually not traders, institutional money.
TLT is like the VXX, when it goes down algos assume that traders are leaving the "Flight to Safety " trade in treasuries and putting the money in risk assets so the inverse correlation is common, but even as the SPX was ramping higher in to the close, Treasuries caught a bid, someone was pretty nervous to drive TLT up against its correlation.
Remember too, I've said and thought there's something big going on in TLT and it will be one of my larger longer term call positions, I have to use options to get the leverage on the position.
These are Yields vs the SPX, they tend to act as a magnet for equities and they revert to the mean sooner or later. Right now, the chart is suggesting that the SPX moves up to the red yields, if you can see the triangle in the SPX, that would put us above the SPX where traders will buy thinking the triangle truly is a bullish continuation triangle and in the process, likely make a new high which they'd likely buy too, again having the Pavlovian lesson of, "Buy the Dip " reinforced as the market starts breaking lower, they'll likely remember the most recent lesson of the $ they lost because they didn't buy the dip.
This is just a chart of GLD, we entered long calls Friday based on the charts and sold today around 11:30, as you can see even if GLD had drifted upward slightly, once you lose the momentum, the profits on the calls start falling away fast. We could have closed at a higher area in GLD and still have less profit or no profit than compared to where we closed at 11:30.
As for futures, there's something interesting I want to show you.
Look at that positive divergence in the USD/JPY that sent it higher today even after breaking $100 which was a nightmare come true for many traders and the BOJ, as I contend in my 2-part article, "Currency Crisis", the BOJ went too big, they lost control and the 4 hour negative on this pair will prove it shortly, but for now, some more upside and north of $100 should be very helpful to the overall market short term.
This is ES after hours (SPX e-mini futures), 3C is negative on the 1 min chart in ES and all of the other Index Futures, perhaps she loses some ground overnight, I mentioned today it wouldn't surprise me if we had a little more accumulation in to a pullback as today's move to the upside is very "V" shaped.
Apply VWAP to ES and it looks like ES is sold at the upper SD of VWAP and accumulated at the lower, likely to have been sold again as I understand average trade size was pretty big. What does that mean? It could mean a bigger base is coming or it could simply be smart money selling in to strength as they always do without putting too much out there and crash the market on their position.
This is the interesting chart of ES (SPX futures), you can see it on a 5 min, but this is a 15 min leading positive divergences in ES, this suggests we do get that move above the SPX triangle and in to the very emotional zone where longs who have been bearish since Friday will be kicking themselves that they didn't buy the dip and shorts will be squeezed out, a perfect set up for Wall St. to drop the hammer and a perfect set up for us to fill out our core equity short positions, by the way, GS is near the top of my list as I saw distribution today in to higher prices whereas AAPL didn't even do that.
I'll post more if anything changes in futures, but I think our thoughts from last week and specifically Friday are still very much on target.