Monday, March 12, 2012

Goldman Sachs Touches on the Cats and Dogs Trade

They call it the laggards to leaders, in any case, it's not exactly the phenomena I have noticed in the market over the last 10 years and that is, just before the market rolls over from a bull move/rally, there's a rally in what I call the Cats and Dogs, Goldman calls them the laggards.

The premise of my version of the C&D trade is that the market is above all manipulated, but also an emotional creature. I have often encouraged students, members and readers of my sites to try to view charts in an emotional light. When you see more the moving averages and you can see emotions, which include mania's, fear cycles, greed cycles, etc (for instance, we are in a mania/greed cycle- when the SPX dropped on March 5/6th, it stopped out a percentage of the longs who had bought over the last 21 days, nearly 1 trading month stopped out in 2 days-this is why I have been saying being long the market is like "Picking up loose change in front of a steam roller" and certainly some longs got steam rolled this month), back to the point, when you can recognize these emotions, you get a lot more information out of a chart.

Why do I say this is a greed/mania cycle? Look at breadth alone and if you think market breadth is meaningless, give it some time, you'll be able to look back and say, "Wow, breadth was warning big time". The longs don't care, as usual, "This time it's different", that is until it isn't- as always.

In the greed/mania cycle, people who saw the new October lows left the market and it probably took several months of rally to get them feeling like they missed it or are missing it, so they enter the market, but being most stocks followed the market higher (until recently as my breadth post proved last week), they don't want to pay for quality so they look for the Cats and Dogs, stocks that haven't rallied yet and are usually under $3-$5. Wall Street knows they'll be shopping and sets up some nice looking charts in the C&D trades. The thing is, they pop and pop hard, often with double digit gains, but they fall even faster, guess who is left holding the bag? This is why when we trade the Cats and Dogs, I recommend taking at least partial profits on any 1 day double digit gain and trail the rest with a tight stop. I have noticed for years this happens just before the bull move ends.

Here's Goldman Sachs version of the Cats and Dogs from ZH...


This year has been characterised by a dash-for-trash as the flood of central bank liquidity sent the marginal dollar into every down-beaten, over-shorted, unprofitable, over-leveraged, illquid stock it could get its hands on. As Goldman notes today, however, this laggards-to-leaders strategy is starting to underperform in the last few weeks. Buying the trailing 12M laggards and selling the trailing 12M leaders had returned an impressive 7% YTD but since mid-February (which notably was when credit started to underperform equity markets more directly) performance of this 'pair' has lost almost 3%. It seems the liquidity-floats-all-boats mentality is indeed leaving the market and with a refocus on growth(that this likely implies) we suspect correlation will pick up once again to the downside.


Chart: Goldman Sachs


ALERT!!!

I haven't done my nightly routine yet, still answering emails when I got an email about the CBOE's SKEW. I looked at it and was shocked, I figured maybe it's a corrupt data feed so I checked it on TOS, the same result. Then to rule out a corrupt feed for the exchanges, I went directly to the CBOE website to confirm and it is confirmed.

 This is my chart, SKEW just hit $139.25 in a +11.6% move today alone!

This is the data directly from the CBOE website.

As you can see, it just surpassed its 52 week high. I'm going to try to find out how high the last high beyond 52 weeks was.

For newer members, here's a brief summary of what the CBOE's SKEW Index is meant to do...

From the CBOE website:

"The CBOE S&P 500 Skew Index (ticker symbol: SKEW), a benchmark measure of the perceived risk of extreme negative moves — often referred to as "tail risk" or a "black swan" event — in U.S. equity markets. "


In other words, SKEW attempts to measure the probability of an improbable event or a black swan/ market crash. For historical reference, the SKEW from 1990-2010 has only been at this level approximately .15% of the time, $115-$117 is where SKEW spends most of its time, so this reading is extremely high and extremely rare. Skew was $135 around the 2007 top.


I will also remind you that the VIX hit a low of $15.23 today showing extreme complacency, the VIX typically trades inversely to the market, low readings often mark tops and high reading mark bottoms. 
The last time the VIX was lower was 7/1/2011 at $15.12, here's what the market looked like...


2 days later, the market started a decline, the S&P lost 18.8% at the August bottom and lost 20.7% to the October low, the Russell lost well over 30%.


Considering the 3C charts, the breadth charts, the Credit/Risk Asset charts and the events that I have expected and have started to unfold as expected, I take this huge climb in the SKEW as a major red flag.


I'll bring you more in the daily wrap... 

AAPL Closing

Honestly, I expected this move in AAPL toward the mid to later half of last week, better late then never and a few days off I can live with.

Oh, earlier I said there were two components to a head fake move, there are 3, 1) the move itself which must break an important pattern, support / resistance or a new high/low. 2) The underlying action in 3C and other indicators should show negative divergences, weakness in to price strength just like the old adage "sell in to strength" and finally there needs to be confirmation which is price moving back below the important breakout area. However by the time we get to step 2), we can often dig up a trade just like with GLD. If we waited for step 3) we would have made ZERO in GLD. Whether AAPL will be the most sensible trade or not remains to be seen, it is the bellwether status that had me focussed on AAPL.

Just using the GLD false breakout/head fake, reversal or shakeout; as an example, it was this post on 2/21/2012 that set the entire GLD trade idea in to motion.

Specifically, it was this chart...
From the longer term analysis of GLD and what was going on in the underlying trade, I posted the GLD probable head fake trade before it even began. This is what I said under this chart on 2/21,

" Here's a close view of the Apex of the triangle and rally off the lows that broke support right to the apex. A trading range has been established, this is a set up for T.A. traders, a breakout from the range is supposed to be bought, but look at the first break to a new high around early Feb. The breakout volume was low, the failure to hold it was on increased volume, longs were stopped out. Now we have another possible breakout of the range and again volume is low. To entice longs to buy this breakout, it will have to make a new high and surpass the former breakout to remove any lingering doubts."

Here's what the underlying action in GLD looked like at the time...

 As of 2/21, negative before the breakout.

 2/21 negative...


The breakout....
MACD and RSI both negative on the breakout...

The red trendline is the breakout trend line, after the breakout, 3C got progressively worse until GLD dropped -5.3% in one day and apparently on no news. I'm not (at this point) saying AAPL is a trade, the point is it just can happen so fast that sometimes other indicators give more timely confirmation then the actual price move, however, that is not as important in this case as we are looking for a total market reversal. It should be noted though that the intensity of the GLD breakdown took out 24 days 922 days in a typical trading month) of longs in 1 day. It's the head fake component that makes these such dangerous reversals.

Here's what the closing action looked like in AAPL today...

 We got the close above both the former closing high and the former intraday high

 Daily MACD is in a nice confirmation trend at the green arrow, it is divergent at the red arrow. Note volume didn't do much of anything today for such an important breakout.


In fact, even on an intraday basis as different levels (the former closing high, the former intraday high, today's new intraday high) were broken to the upside, volume was muted.
Today's hourly price and volume in the white boxes. The GLD volume on the breakout wasn't impressive either, but it was at least on increasing volume, today AAPL's volume diminished.


 RSI uptrend confirmation and RSI breakout non-confirmation or a negative divergence and I used a fast setting to give it the benefit of the doubt.

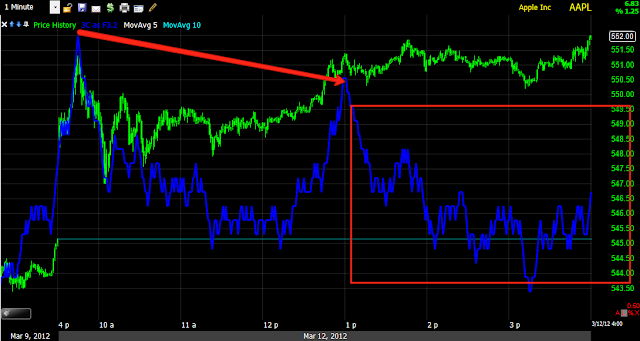
Below is today's intraday 3C chart, remember earlier I thought maybe 3C may move higher or at leat to the same level as the open at the right side of the red arrow upon AAPL breaking above the opening highs, that didn't happen, in fact it got worse.


On a slightly longer chart and longer timeframe, Monday's head fake move sending AAPL lower was already negatively divergence, which simply suggests that smart money was already in the trade short as their positions are large and take more time to put on without moving the market against them. I used yellow arrows to show 3C/price trend confirmation, this simply means 3C is moving with price and there are no divergences; that didn't last long. Again, it take Wall Street more time to put on their large positions, otherwise they move price against their position. Usually a important breakout will give them enough liquidity to get their trades off.


On the 5 min chart, again, 3C was already negative before Monday's head fake move. The positive divergence here is small, it's enough I suppose to get the bounce moving, but it doesn't look like the idea was to buy low/sell high and then move to a short position.

The 15 min chart also shows 3C negative before Monday's head fake move in the yellow box. The yellow arrows show early confirmation in the bounce, again it didn't last long as the red box around 3C represents a leading negative divergence. In orange I put boxes around 3C at two relative levels, one around 2/27 and one today. I put light blue boxes around corresponding price levels, this is to show you how much lower 3C is now at significantly higher prices, this is the essence of a negative divergence.


TLT

If you recall the theory of AAPL laid out last Sunday, one of the things I was looking for on an AAPL breakout was TLT to head toward the bottom of its recent range and on the breakout, start to be accumulated, that would signal that professionals were reaching for the flight to safety trade.

As AAPL breaks out this afternoon, take a loo at treasuries (I know there can be more then 1 reason for this, but this is part of the idea).
TLT is exactly where I thought it would be when I first published my AAPL theory, right at the bottom of the range.

 TLT's inverse relationship with the SPX (white) is not so apparent today as TLT is up, not much, but gapped up, pulled back and then...

 Here's the pullback expected in treasuries, and a 15 min positive divergence...

 Late day as treasuries stop falling and start flattening out, a positive divergence.

 The same on this 2 min chart which is actually leading.

And the 1 min chart. Since I doubt it is likely that the F_O_M_C announces QE3 tomorrow, I don't think this is as much related to that as it is the expectation that there would be a flight to safety on the AAPL breakout, which we already saw in today's sector rotation.

BPZ

This is a small energy stock that has had a nice 2 day run, ironically this was the first major home run 3C hit when I first started using it, I think a 400% move or so. In any case, it just went negative earlier, if I was nimble and had the time to be nimble, I might even play a quick short on it, but the more interesting trade is a pullback and see if BPZ has anything left in the tank. I'll have it on my watchlist and throw some charts up in a bit.

Market is starting to turn

And it's late in the day, the time the pros come out. We have the FOMC tomorrow, I would think there will be a bit of a holding pattern until 2:15, unless there's a leak. Keep an eye on AAPL, I doubt it will give up the new closing high, but you never know.

Market/AAPL Update

 The DIA appears to be one of the weaker underlying averages, in the yellow box is the triangle I mentioned that has barely broken out, there's a leading negative divergence on this 1 min chart and there have been no positives even intraday.

 Again the 2 min chart confirms the same, DIA at the green arrows is not a positive divergence, just in line with price, but since the breakout of the triangle, a leading negative divergence is in place.

 The 5 min chart looks even worse.

 ES hasn't done much in the way of divergences most of the day, but there is what looks to be a leading negative setting up there, if it turns down shortly it will be confirmed and worse.


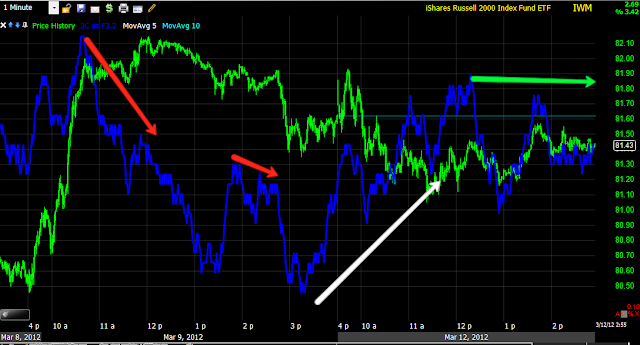
 The IWM is the one average that looks like it wants to try for higher prices, there's a positive divergence that is fairly large for an intraday chart.

 The same on the 2 min, recently there's been some negative activity, but I would guess that may be a consolidation comparing it to the preceding positive divergence, again intraday.

 While not as strong, the 5 min chart also shows a positive divergence, it looks like the IWM wants to try to catch up to the other averages.

 The QQQ is somewhat negative here on the 1 min, that leading negative in the red box could be part of a consolidation, we'll have to see if it dips even lower.


 The 2 min chart is showing what I hoped to see, underlying weakness.

 And the same on the 5 min.

 The SPY saw a small intraday positive earlier, right now it's in line with price on an intraday basis, longer term even on this chart, it's still in a leading negative position.

 The 2 min chart is about the same, except the leading negative and the longer chart is more bearish.
Essentially some intraday positive divergences that move price intraday, but the bigger picture is still weakness in to any gains in price.

 The 5 min chart is almost exactly the same, yet again because it's a longer chart, it is more bearish.

AAPL
You know I've been looking for a head fake move in AAPL, there are two components, 1) we need a breakout above an obvious level that gets buyers (retail) buying. 2) We need to see underlying weakness in to the price advance, same thing as the  GLD set up.
 Earlier I thought maybe the point in which the red arrow is toughing on the right may move higher with a move higher in AAPL, it didn't, in fact things have gone downhill since then.

 The 2 min chart shows exactly what I thought we'd see and why I said I was looking for a head fake break out and not just a breakout, the underlying weakness in to the price advance is what gives away the head fake move.

Look at the divergence on the 5 min chart since AAPL moved north of morning resistance, this is exactly what I thought we'd see.

Risk/Credit and Context

There are some surprising moves in these indicators, actually they are what I'd expect, but I think the extent or intensity is surprising in several.

Just for reference, this was last night's ES CONTEXT model, which showed ES trading rich compared to the model, it seemed like a pretty strong divergence as of last night, compare to today below.


This is today's ES model, to the left is last night's divergence, look how small it is compared to today's.


As for the VIX, it hit nearly 1 year lows today around 15 and has rebounded from those lows, the CONTEXT model still has VIX undervalued vs their proprietary model.


Commodity momentum vs the SPX (green)
 Intraday commodities are lagging a bit

 Looking at the entirety of the bounce, you can see the extent to which they are really lagging.
Note Friday's unusual activity that came unglued from the FX correlation, but still wasn't enough to bring commodities in line.

 A little longer view of commodity relative performance vs the SPX, it's just not there especially if you make a relative comparison as to where the SPX was in Feb (at the highs) and where commodities were at the same time vs. now.

Euro vs. SPX
 We see some mostly in line correlation, although the Euro did signal a divergence sending the SPX lower, at the yellow arrow is the strange activity Friday where the correlation completely broke down, it looks to me as if equities were manipulated higher and all of the arbitrage algos were turned off Friday.

 A still longer view of the Euro/SPX, green arrows show the correlation (roughly), red arrows show divergences when the EUR didn't follow the market higher and now since Friday, the divergence is pretty extreme. Based on looking at the history of these charts, there's almost always a reversion back to the correlation.

 Intraday the EUR on a RELATIVE basis, out performed a bit earlier, setting the market up for a move higher, that seems to have stalled.

 HY Corp. Credit is still not excited about the bounce, intraday it's selling off vs the SPX.

 Look at Energy's underperformance today...

 Over the last week or so, Energy has virtually nose dived.

 This is a longer term view, Energy was divergent at the 28/29 and March 1/2 sending the market lower or contributing to the move. Again look how divergent Energy's relative performance is now.

 Here are financials lagging today relative to the SPX momentum


 Look at the difference between Friday with Financials leading and today.

 Tech above was lagging the SPX Friday, but improving as the SPX was flat, that has continued today.

 This is the same chart, just with AAPL overlaid in light blue.

This is interesting, this is sector relative performance/rotation from Friday.

 Note Financials came back later in the day, the defensive Healthcare sector was rotating out, Energy was rotating out as was discretionary with Tech starting to rotate in.

Now below you can see Friday and today, this is where the extent of the moves are surprising.

Financials, Basic Materials, Discretionary and Energy vs Friday have fallen off a cliff, the defensive Utilities (red) and Staples have come in to rotation in a huge way, Healthcare and Industrials have held their ground. Tech is in rotation, but not to the degree of the other moves seen. This suggests VERY defensive rotation today.