Wednesday, June 18, 2014

Another Chart Oddity...

Along with the Safe Haven Utilities nearly doubling the performance of any other S&P sector today, high yield credit selling off, CONTEXT at what is now a -33 ES point (negative) differential, Carry trades selling off, odd end of day churning with the highest volume of at least 7-days on a 5 min bar (pros tend to trade the close), I just saw this as well.

I saw the 30+ year as it related to SPY arbitrage, but when you have a chance at market yield, why would you be buying safe haven treasuries in to the same move as the market?

10 year Treasuries were bought right at 2 p.m. sending the 10-year yield to 2.59%
10-year Treasury futures bought right at 2 p.m.

Meanwhile, INDEX futures, still absolutely flat.


Daily Wrap: Knee Jerk Edition

There's a reason I warn of the knee jerk reaction, and how it is almost always wrong, before every F_O_M_C event and I have been for 7+ years, as said earlier today and yesterday, the knee jerk reaction typically lasts from 2 hours to 2-days (I gave an earlier example of the Sept 13th 2012 announcement of QE3 and it's initial knee jerk up which reversed the next day and didn't see those levels again (after losing 8% on the announcement of what the market was looking for, more QE) for another 4 months.

While the F_E_D's policy statement seemed benign and not much changed, smart money didn't seem to take it the same way as evidenced by the CONTEXT Model (see the bottom of the post for an explanation of CONTEXT).


ES/SPX futures are in red, the CONTEXT model based on what other risk assets are doing is in green. At 2 p.m. you can see a huge divergence between CONTEXT and ES, it currently sits at a -32+ ES (S&P futures) point negative differential, risk assets trading together would ideally have a differential of zero.

One of the most obvious signs of a "Risk Off" move among smart money would be found in the carry trade which is bought to leverage positions when going long or leverage AUM-Assets Under Management, rather the carry trade was sold off, one of the reasons CONTEXT looks as it does.

USD/JPy  looked like this...
Sold off, even pierced the $102 level which the Bank of Japan has been defending. When the carry trade fades, managers are moving away from leverage/risk. The EUR/JPY Carry trade was also sold.

This weekly chart of USD/JPY goes back to 2011 and shows how institutional managers leverage up when in a risk on mode...
The carry trade is opened and moves higher as the USD/JPY does here vs ES (purple), a far cry from this afternoon's selling of the carry pair.

Another institutional risk asset that would "normally" move up in a true risk on move would be High Yield Credit, here it is today vs the SPX...
HY Credit didn't budge with the SPX, lending further credibility to the "Knee Jerk" reaction.


It's interesting that the short term market manipulating SPY Arbitrage would have to be used, but it was.
 Just after the 2 p.m. announcement the environment for SPY went slightly negative and then the SPY arbitrage consisting of 3 assets (to move the SPY up, HYG must move up, TLT and VXX down).

HYG moved nearly perfectly tick for tick with the SPX as the SPY Arbitrage lever was activated, but it seemed to have some trouble at first as TLT (20 + year treasuries ) were up.

TLT in blue vs SPX (green), for SPY arbitrage to work, TLT must have relative weakness along with VXX vs. HYG's relative strength. If you look carefully at SPX price you can see the initial move was not as sharp as it was when TLT showed weaker relative strength, boosting the SPY Arbitrage.

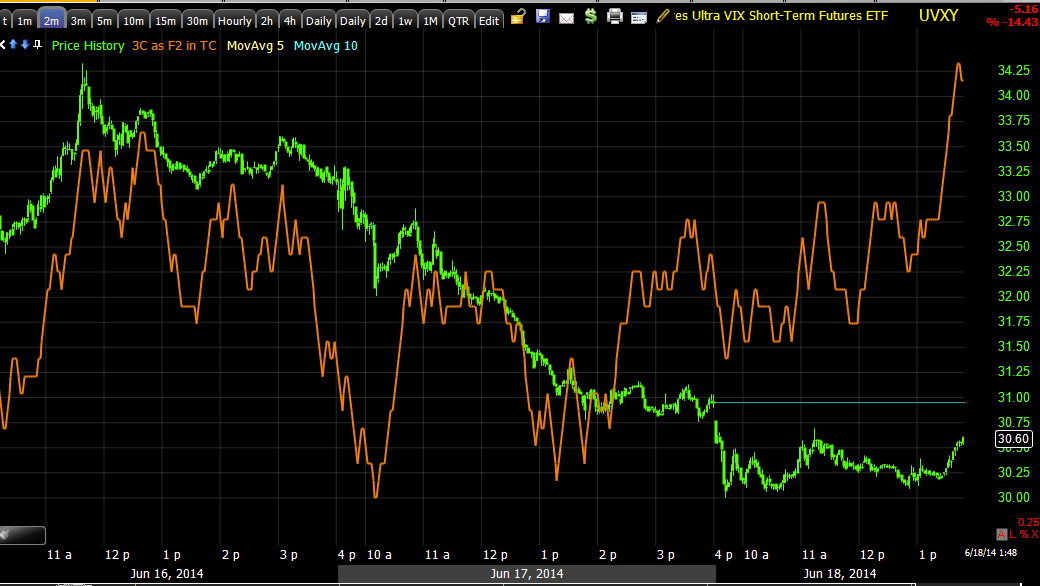
 The 3rd asset in the SPY Arbitrage model is VXX, this has to be monkey hammered down and boy did they, in fact...

VIX closed at lows not see since February of 2007!

This gave momentum to the Most Shorted Index as it squeezed...
Russell 3000 Most Shorted Index (red) vs the SPX (green), this is likely another reason there was no confirmation of the move wither pre or post Yellen as short covering is not accumulation and certainly not by strong institutional hands.

However, interestingly, among the SPX Industry groups, the one to finish with the greatest gains today, twice that of any other sector, was the defensive Utilities, up 2.27%.

As shown twice after the F_O_M_C, we had no confirmation among even the shortest term charts, with VIX not trading overnight, it will be interesting to see how Index futures fare as they have stalled out as of now...


Russell 2000 futures along with NASDAQ and SPX stalled out totally flat just after the close (red vertical line).

And as we saw in to the close, especially in SPY, there appears to have been a quite strong churning event.

Churning on 5 min SPY chart, there was zero % gain during the largest volume of the day at least the last 7 days (5 min bar) (as far back as I can go on a 5 min intraday chart)
The last 3 mins when this volume occurred didn't see any gain, in fact a slight loss of $.04, in fact the last 15 minutes of SPY trade saw no gain, actually a small loss as it flat-lined.

We know to expect the knee jerk reaction after an F_O_M_C event, that they tend to be very transient, that they tend to be wrong as price reverses, but why would smart money be running in the other direction (not only no 3C confirmation, but a 30+ Es point differential in CONTEXT?

While on the surface the F_O_M_C policy announcement seemed quite benign, if not contradictory, especially as it relates to an 8 month trend that has seen inflation double which Yellen called "Noise" in her press conference, if you looked closer...

The GDP forecast for 2014 was cut from 3% in March to 2.2% currently. In addition the Fed Funds Rate Forecast that the market is concerned about crept up, even though there's 3 new voting doves on the F_O_M_C this meeting. The former 2015 end of year FED Funds rate was 1.1% in April, it climbed to 1.2%, the 2016 forecast was 2.4% and climbed to 2.5%.

As the WSJ's Jon Hilsenrath said in his article 9 minutes after the release of the minutes, ")The) F_E_D's new interest rate forecast imply slightly more aggressive credit tightening plans taking shape, more than previously thought", and that seems to be the data that was pulled out of an otherwise "boiler plate" (as it is being called)  policy statement.

As previously mentioned, with such a SPY Arbitrage dependent move (evidenced by the flat futures right as the market closed as VIX doesn't trade overnight), it will be interesting to see how Index futures trade through the overnight session and in to the next day or so as Quad Witching sneaks up this Friday.


*Context model:The world has become an increasingly inter-connected place to trade. Whether due to central bank liquidity or the shortening of business cycles, asset-classes tend to behave in highly correlated ways most of the time. The CONTEXT framework attempts to distill the world’s ‘risk’ asset-classes (interest-rates and curves, credit risk, FX carry, commodities, and precious metals) into a single-measure that can be judged against the US equity market in order to comprehend potential mis-pricings (or technical flows and liquidity impacts). Institutional and algorithmic clients tend to use CONTEXT as a confirmation tool for positioning against (or with) a trend. CONTEXT provides a 24-hour-a-day real-time indicator of the world’s risk appetite and whether US equities are over- or under-pricing that risk.

Context Model at -30 SPX Point differential- Daily Wrap Coming

Right now the Context ES model is 30 points below ES, the model is constructed using risk assets that normally rally together with the markets, like High Yield Credit, when there's a large divergence like this in the model, it means stocks are rallying, but other risk assets (like credit which is what the pros use) are not rallying and in fact may be selling off.

The general take away is that this has every hallmark of a knee-jerk reaction and one that's about 30 S&P points rich vs the model, considering the SPX gained just under 15 points today, the negative 30 points in the model suggest professional risk assets sold off on the F_E_D news.

The divergence is clearly at the F_O_M_C, which means, professional risk assets SOLD OFF ON THE F_O_M_C STATEMENT

It's little wonder we didn't see any confirmation in the averages.

Churning Into the close

This high volume churning (very high volume with price making no gains, typically a distribution event when smart money hands off shares to dumb money) is most obvious in the SPY & QQQ, but it can be seen in all of the averages.

SPY closing high volume churn...
The same in the Q's


Near Term Position Management

As this is looking very much like the typical Knee-Jerk F_O_M_C reaction I ALWAYS warn about in advance (being there's no confirmation on even the fastest charts), I will hold the UVXY long position for a bit longer, although this will not turn in to a position trade.

I will hold the IWM puts with next Friday's expiration as well.

The one I'm most concerned about is the NUGT long, now up +21.5% , but since there is confirmation on 1-3 minute charts, I'll continue to hold it for the time being, you probably know what my concern is with closing it for a pullback considering the higher probability long term charts leading positive so strongly and an obvious concern over inflation.

Post Yellen Market Update

Not much has changed since the pre-Yellen market update and the post Yellen market snapshot, this looks like a knee jerk reaction, if you actually go through the F_E_D's complete policy statement and accompanying charts, there was a modest hawkishness that Jon Hilsenrath of the WSJ was writing about and had published a mere 9 minutes after 2 p.m., of course that's because he has the information ahead of the announcement, just on embargo (that's probably worth quite a bit to quite a few people on Wall St.).

His take was similar, slightly more hawkish than the headline came off.

In any case, we'll get to that later, for now a snapshot of the market with the SPX finally breaking 1% which is not that impressive on a knee jerk move, the other averages are each consecutively about .25% lower (+0.75, +.50).

*I'm still using the fastest charts as they'd have the ability to reflect changes the fastest.
 DIA 1 min within the broader trend, which is interesting , but makes the specifics of today hard to see, so here's a closer view of the same chart on an intraday basis.

DIA, not confirmation, in fact it's a negative divegrence which would indicate selling in to price strength, the same idea we had about AAPL, PCLN, NFLX, IYT for this week.

 IWM 1 min

 QQQ 1 min not moving at all.

And SPY 1 min

I can't get my computer that captures charts to display futures information, but on my other systems, Es 1 min is in line, both NQ and TF are negative, I haven't had a chance to see how it has effected longer 5, 15, 30 min charts yet.

Miners keep climbing which is making me a bit nervous about that pullback considering NUGT gains. I'll look closer at that, GDX now up +2.36%

And take a look at the F_E_D's track record for forecasting 2014 GDP...

From 3.4-4% to just above 2%, Houston...!

Quick Snapshot

The market will move so fast I won't be able to get charts out fast enough, but on the initial knee jerk which has been mellow (look at the daily changes today), here's the lack of confirmation, since there has been a parabolic looking curve now moving or starting to move to the downside. I think their Interest rate outlook is wildly inconsistent with data and trends and this may be concerning to the market.

I'm using short term charts as they will reflect the newest information since the policy announcement first.

 SPY 1 min no confirmation

SPY 2 min no confirmation, not even trying.

SPY 3 min, no confirmation

IWM 1 min, no confirmation

IWM 2 min no confirmation

IWM 3 min

QQQ 1 min no confirmation whatsoever

QQQ 2 min no confirmation at all.


Quick Market Update

This may be because Yellen is yet to speak, but so far the market is showing NO CONFIRMATION of the initial knee jerk move.

More Evidence Miners will lead...

So far GDX (gold miners) is up +1.62% and climbing (NUGT longs must be happy), while GLD is up +0.21%...

The old normal is starting to resume...? It appears that way.

F_E_D Slashes Growth

So we have an "economic rebound" despite Q1 2014 GDP at -2%, real wages down, food and fuel at huge inflationary moves from yesterday's CPI, real wages declining, everything is ok, yet...
The F_E_D slashes their growth forecast from March...


2014 GDP GROWTH OF 2.1%-2.3% VS 2.8%-3.0% IN MARCH hmmm...

Initial Knee Jerk

+1100 then minutes later, -1250 from a very tight range before the F_O_M_C

There's more volatility to come with Yellen's press conference in about 20 minutes.

Pretty Blah F_O_M_C

There were some revisions to median interest rate expectations, otherwise a pretty blah statement that seems to have no basis in reality, "Economy has rebounded"? Q1 GDP at -2%? That's a rebound?

No mention of inflation, labor market improved even though real wages are down .1% while gas was up .9% and food up .5% just for May!

Yellen's press conference should be around 2:30, expect some hard questions.

VXX / UVXY Charts...

While this could just be pre-F_O_M_C jitters, the moves in volatility look sharp.

 SPY 1 min sharp downturn

SPY 3 min looks like a little more than nervousness.

The sudden spike in UVXY is interesting.

And even out to a 5 min chart.


Trade Idea: UVXY Long

I'm going to open a trading position (speculative/half size) in UVXY. I don't know if this is a leak, but the 3C charts have really started moving up in volatility, down in the averages, I'll open an equity UVXY long (2x long VIX short term futures).

I may look to sell this in to any initial knee jerk moves or may hold depending on what the F_O_M_C says, this is not meant to be a position trade, just a trade.

Market Update before F_O_M_C Radio Silence

I'm not going to be posting too much between now and the F_O_M_C, looking for any hints there's a leak. Right now the QQQ is flirting with breaking below the bear flag, the SPY and DIA have bounced a little off the lower trendline (support) of the flag, but the intrtraday readings are not impressive, this looks VERY much like a holding pattern before the F_O_M_C.

However, I may post 1 more time, looking at volatility, there are some signals that I showed last night that are interesting, of course there's going to be some buying of protection before the F_O_M_C, but if it looks to be more than that, considering the short VIX trade (how massive it is), this could be one that flies with the right (or as the market would take it, the wrong) wording from the F_O_M_C, basically anything hawkish, anything that suggests ZIRP (rate policy) may not be in effect until mid-2015 as is the market's consensus, this would be due to hot inflation and diminishing real wages. The F_E_D has met and surpassed their mandate, inflation has to be a concern as the trend over the last 4 months has been very hot, the trend over the last year has been high and extra high over the last 8 months, to cool inflation, RATE HIKES, the last thing the market wants to see, just look at the correlation between rate hikes and markets turning to downtrends/bear markets.

The charts...
 IWM bounce is not seeing any confirmation intraday

IWM's larger trend since yesterday going negative is holding.

Q's had a small positive intraday, but haven't done anything with it, again, like I said this looks like a holding pattern.

SPY bounce is showing distribution intraday

And the longer term intraday charts are no better.

The 3 min is even looking worse as if the bear flags will be broken to the downside. If it weren't for the wild card of the F_O_M_C, I'd say this flag would break to the downside without a head fake move, we'll see if the knee-jerk makes a move in that direction, but as of now, I'd say there's a mild negative to tone in the bear flag.

I'll be looking at volatility a bit more closely, if I decide to enter a position before the F_O_M_C, I'll let you know of course.

AAPL Update

This is one of the stocks that I was hoping last week, would bounce in to negative 3C divergences giving us an opportunity to open a high probability, low risk short trade, or perhaps something even longer.

Here's the full update and why we may still get a chance...
 This is a weekly Heiken Ashi chart with a downside reversal signal. Note the volume by price to the left...

 This is the weekly chart, notice the expanding volume on the rise in price BEFORE 2009 and the decline in volume after 2009 (QE).

 Note the trendline of price, a nice clean, stable trend, then the increased ROC in price that leads right in to a top, we have a similar situation right now.

This is the 60 min 3C chart, I've been watching AAPL for a while, the 15 min chart was horrible, but the 30/60 min weren't negative, they are now so I'm interested.

 This is the 30 min chart from in line to negative

And the 15 min chart that started it all, thus I'm interested in an AAPL short, I was looking for a bounce to short in to.

 I was thinking this 5 min chart would develop in to a stronger positive, it's not all that strong as of right now, but it still looks like we could get out bounce.

The intraday 2 min also suggests the same and..

The 2 min intraday has a small positive, it looks like it can barely get price above yesterday's close, but with the 5 min intact, we'll see what we can get out of it to set up a nice position.

The 1 min looks similar. I'm going to set some alerts for this one and see if we can't find a decent entry, this looks a lot like a counter trend bounce on a daily chart, they tend to be sharp and convincing looking, but they ultimately resolve to a lower low (daily chart), thus AAPL looks like a pretty interesting set up if we can get in at the right place.