Tuesday, January 14, 2014

Quick EOD Update

I will of course take another look, but finally got around to Leading Indicators.

As I mentioned before, the 5 year Treasuries were sold a bit today, likely a rotation to risk, I'm not sure about the T-Notes that were going negative in yield yesterday as a safe haven rotation, I need to check those.

The SPY Arbitrage is now negative -.$.30 and CONTEXT is almost negative as it has moved down to $3.93 and that's all on Es gains, not the model moving up or down, which I think has more to do with carry than anything.

HYG was seen underperforming late afternoon, I need to check 3C, but there was distribution as of this morning. VXX had been underperforming its SPX correlation early in the day, but improved as the day wore on and as you know, VIX futures were going positive intraday, VXX/UVXY has good 3C signals today as well, it did look like they were trying to set up a closing ramp, like the last 5 minutes or so, but apparently that fell apart, you can see it in VXX's late day down draft and a push lower in TLT as HYG looks like it's almost out of the game.

I just checked the 3C charts for HYG, YES, INDEED, they continue selling in to price strength and there are VERY clear negative divergences in to the 11:24 and 3:24 highs, the distribution is unmistakeable.

TLT's price action today seemed to hold up a lot better that the 3C charts so I think TLT will come down which is fine with me as I've been waiting a long time for a long position there as a core/trending long. As I have mentioned for the last 6 months of watching TLT for the right position, the 10 year bond is a totally different ball game. If HYG falls and VXX gains or holds, TLT can pullback and cause no Arbitrage activation. By the way, I'm looking to leverage up TLT without using options so I decided I'd use TBT short. Speaking of which, there is still an open TBT long position which I'll leave in place until TLT pulls back and is ready for a long, then I'd close TBT long and go short TBT.

High Yield Credit which strangely held up pretty well yesterday took a bit of a dive today, first lower on the day then made a lower low in to the close (3:45) so that's interesting as well being it DOES NOT have the correlation and arbitrage value that High Yield Corporate Credit has.

ES was intraday positive in to the close, NQ was negative and TF was in line which is interesting because eSPY intraday was not positive on the day, but put in a positive divegrence toward the close, QQQ put in more of a negative and IWM basically didn't do anything, just like their Index future counterparts.

Actually IWM made its first intraday 1 min negative divergence of the day (recall it had been in line all day), at 3:45 it put in its first negative. Other timeframes were negative in the IWM, I'm talking about the 1 min chart only,

I'm going to update my system so I can get the internals/breadth scans updated and check a few things in FX and I'll be back.


Sentiment (we use two indicators) was somewhat odd, one was in line which I would consider short term bullish while the other was underperforming.

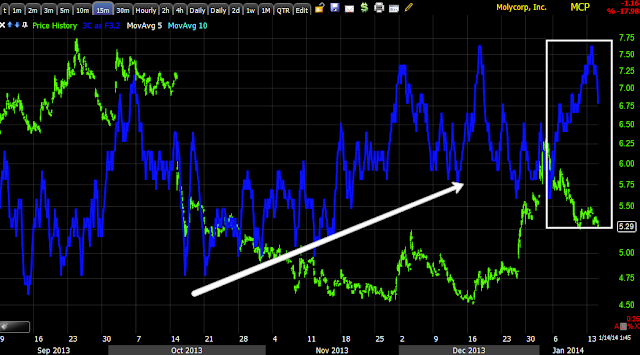
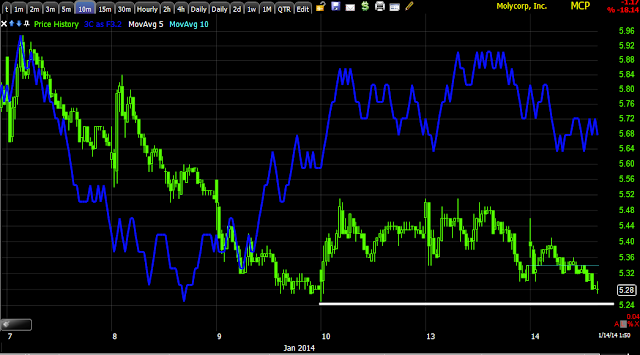
MCP Still looking for < $5.25

As you already know, I went ahead and opened a partial MCP long (core long position has stayed open as well as calls). As you also know I'm either looking for the more probable head fake/stop run move to add the second half so long as it is verified as a head fake which I'd say 90% it would be or I'm looking for the 1, 2, 3 min charts (and more if possible) to just sky-rocket, you know what the charts look like when I say, "I can't ignore a divergence like this".

So far, I think MCP is likely to make that head fake move.

You can set a price alert for a move below $5.25, usually the more extreme looking they are, the more useful they are as a failed move creates a fast move to the opposite side.

Being it looks like a "W" base, this is also a very high probability for that and larger double bottoms, in direct contradiction to everything technical analysis has taught about the price pattern for nearly a century, that's because it's predictable, I know what traders will do so the guy sitting there with the entire book in front of him with all of the stop orders, limits, etc. knows even better.

I think the intermediate/long term charts make MCP a winner no matter what, this is a question of deploying dry powder at the right time and getting the best entry we can.

Market Update

There are a few other things I HAVE to look at before trying to assemble the composite picture, but the bottom line is no damage was done today to the bearish case, either long term or yesterday.

Here's what I'm generally looking at and my general concern in jumping in to positions too quickly (market correlated ones)...

I'll use the SPY as a more thorough example to save time and post the other charts intraday.

 SPY 1 min intraday leading negative, it seems price strength is being distributed in to just as you'd expect which is also part of the process (the first step) in closing a carry trade, but this could also be short selling as both are sales when they come across the tape.

SPY 2 min migration of the negative divegrence, also leading negative

3 min leading negative, once again compare the negative divergences to the accumulation at the white arrow, it's just like putting gas in your tank, if there's only a little, you're only going to go so far, there's no support and at some point what is there runs out.

I think the bounce today is a dead cat as was depicted in last night's Market Wrap analysis, the Dominant Price/Volume Relationships were across the board suggesting yesterday was a 1-day oversold condition and the most common occurrence after that is for a close higher the next day, but this is a 1-day observation only or until the next Dominant P/V relationship shows up.

 SPY 5 min leading negative yesterday in to the highs of the day when the NDX actually went green on the year, only to lose it badly.

At 5 mins, a stronger underlying timeframe and the first that shows institutional intraday activity, notice our small positive divegrence on the 3 min chart is nowhere to be found on the 5 min.

 The larger cycle off the 10/9 lows from accumulation and a head fake move that started the move from stage 1 base to stage 2 mark up, then initial distribution, or stage 3 top (in any normal market this first divergence red arrow- on a strong 30 minute chart would be more than enough to send the asset to lows below the 10/9 lows.

The Leading negative 30 min, as I showed you, has seen much of that move done in single day periods, in other words, massive distribution over the course of a day, a breather and another round of distribution. 3C essentially falls off a cliff here in a flat range where we see divergences most often that lasted over 5 trading weeks, talk about an extreme divergence/market.

IWM 1 min was in line earlier, it's still in line, but this is intraday activity only.

At stronger underlying flows like 2 min you can see distribution or institutional selling in to higher prices. I say institutional because retail generally sells after price has turned, institutions are the ones selling in to higher prices because of their size.


IWM 3 min leading negative

QQQ 1 min in leading negative position

QQQ 3 min leading negative especially as price starts to range.

QQQ 5 min, a very clear institutional move today as would be expected.

ES/SPX futures intraday negative

So there are quite a few negatives so why not just go hog wild shorting? Remember the move today is sponsored not by accumulation, it's not there in sufficient size, but in tricks and levers, smoke and mirrors, the SPY Arbitrage, the Carry Trade dead cat bounce, etc so those are the assets that dictate the market.


VIX futures are seeing a bid as earlier with a leading positive divegrence which is a very important indication for me.

The EUR/JPY carry is what the market is following as well as USD/JPY. The red large arrow is showing 3C distribution in the asset.

The others are showing changes in character from a healthy move in green to a more parabolic/unhealthy move in yellow and now flattening out in orange. As you'll recall, we almost always see an increased upside Rate of Change in price just before it makes a top.

 The USD/JPY made it to $1-4, there's a slight 3C negative, price is also parabolic.


 This is the Yen single currency future so it's getting knocked down so the carry pairs can bounce (and likely at the hands of the BOJ), but just like last time we are seeing accumulation or buying in to lower prices. Remember the last time we saw this in size, it was only a few days later that BAC came out and said they covered or closed their USD/JPY carry.

As I suspected earlier today, any drop in Yen pricing is going to be an attractive exit for carry traders.

5 min Yen also positive

And the 30 min remains positive, no problems here at all right now.

What does concern me is the Dollar Index futures. Now you can see yesterday that they weren't really active and the carry pairs still moved so because this is the actual Dollar Index and not a straight single currency it is more difficult to say what effect it will have.

5 min leading positive, but you can see as the USD/JPY fell yesterday the USDX didn't make that big of a move.

15 min very positive

and 30 min positive.

I'm not sure, like I said above because it is the $USDX, whether or not a positive divegrence and a subsequent move will have an effect on the carry pairs. don't have anything similar for the Euro so that's something.

This is probably what I'm most concerned about right now in NEW POSITION ENTRY TIMING...

More to come....

Market Update

All Index Futures are negative, all market averages are negative.

I'm seriously considering a VXX or UVXY long trading position.

Hang on.

USO Second Update

This is today's earlier USO update..

I still like USO, I may even enter it today, but for the moment the intraday charts look like it has some backing and filling to do. I already expressed some question (not really concern) whether the reversal process was large enough. There's  also the Head-Fake concept which applies in about 80% of all reversals in every timeframe.

 1 min intraday Leading negative

2 min intraday relative negative

 3 min relative negative, the migration process of the intraday divergence makes perfect sense from a weaker 1 min chart's stronger leading to a stronger 2 and 3 min chart's relative (weaker divergence) and the migration itself.

The 30 min chart makes me think the base or reversal process is the smaller of the two envisioned in the first post linked above because you can see the first divergence is at the first pivot in the "W". We have some space that can be filled and of course the possible/probable head fake move (yellow arrow). 

I'd definitely set some alerts if you haven't already.

Trade Idea: MCP Long Trading Position

The 1 min chart is starting to lead so I'm going to go ahead and at least enter a half size trading position.

You might set some price alerts for a head fake move.

Getting Ready to Open MCP Long Trading Position

I'm not quite opening it yet, I'll likely start with a partial position and add to it if it makes a head fake move, I may even add to the Calls, depending on the head fake move and if we get it. I do think it will be opened today though.

Here's what we have and remember, MCP is one of the few stocks that is NOT correlated with the market, it does its own thing so the market is not a concern, only the signals in MCP.

On the X-Over Screen, we now have a confirmed long, all 3 indicators are flashing a long signal, we have the initial pullback to the yellow 10-bar moving average as is normal and now 3C is giving strong signals, the base is in place, the only thing may be a head fake move which is an excellent timing marker and a better entry.

 The 60 min chart and longer, never went negative, it only showed a pullback divergence.
There's an enormously strong accumulation base and we are in the lower end of the base, not even close to stage 2 mark up so this is why I never touched the core long position, I just let that one hang in there through the pullback.

 The 15 min chart is leading positive in the pullback area, but we needed a few more timeframes and we needed the reversal process to be in place.

The 5 min chart is now leading positive on the pullback, this is always what we want to see when buying a pullback.

Here's the 3 min intraday chart leading positive so timing wise, it looks like MCP is prepping for a move. The yellow arrow would represent a head fake move (stop run) and where I'd prefer to open the position, but I would like to at least have a partial position in place and then add to it if we get a better entry, I always make sure my risk management reflects this BEFORE I enter the position, this is NOT dollar cost averaging, it's a tactical entry.

A closer view of the 5 min'

The 10 min

The 15 min.

I'll let you know as always.

Market Update

 far there's really nothing that looks too troublesome, even though a couple of the averages are doing some massive retracement, they are doing it on the typical levers and a whole lot of BOJ help (I think $104 is the target for USD/JPY) as well as SPY Arb, which is not in the best shape, but they managed to hold most of it together yesterday.

Here's what we have thus far... First as mentioned first thing this morning, since there was so much downside/panic yesterday, it left the 5 min Index futures some room to move, we'll see what they look like at the end of the day, they certainly weren't leading by any stretch.

As for the averages...
 IWM 1 min is still in line.

IWM 2 min showing some distribution near the intraday highs

 IWM 3 min picking up that same distribution

Put in context, this is the IWM 5 min chart so it has a ton of damage and isn't anywhere near what you'd think by looking at 1-3 min intraday charts alone, all of the averages are like this and the further out you go, the worse it gets.

QQQ 1 min with late day small accumulation yesterday, in line earlier and distribution setting in

 Some migration to the 2 min chart, a small relative negative divergence, it may just be starting or it gets run over. To the left you can see the massive leading negative divegrence/distribution that caused yesterday, the accumulation is no where near this distribution.


QQQ 3 min looks as it should considering the 1 and 2 min.

QQQ 5 min in context again, like the IWM, nothing much is happening in underlying trade today.

 SPY 1 min with the same late day accumulation yesterday as the carry trades turned around 3 pm and some distribution setting in

The distribution to the left leading to the fall yesterday, note you can't even see any accumulation here vs the distribution on the left so that tells you a lot and just about all you need to know about today's move.

 SPY 3 min, again distribution at the highs yesterday, accumulation is very very small relative. Otherwise, this chart is close to in line, give it some time as they are starting to deteriorate.

TICK Data
 Today's TICK is fairly mellow considering the R2K and NDX, about +1000 to -500 range

Yesterday's added to the mix with -1500 . Today's TICK really isn't even trending, just range bound so you might watch it, draw a trendline on the lower end of the range and pay attention for the TICK to drop below that -500 area. This is NYSE intraday TICK data.

My custom TICK indicator, nothing special, it's about in line with the SPY 3C charts intraday.

As far as the arbitrage move which is a big part of today's move with the carry trades...
 HYG's price is up, that's all the arb. algos can read, but you can see there's distribution in to HYG so how long it can stay up is questionable.

VIX Futures (not spot) are seeing accumulation so there are still some worried traders out there bidding up protection which is great because this is one of the maion areas we are paying attention to.

TLT is the 3rd asset, it needs to be down for the arbitrage to work, I told you yesterday there's short term negative divergences, I think it ran a bit too far, too fast and too parabolic so it should work some of that off, I'm still very interested in a long term long position here.

Point being, any downside in TLT (so long as HYG can maintain) will help the Arbitrage mechanism.

This is the SPY Arbitrage model, you can see it's losing it's umpgh, it was near +$.80 but the move in the SPY is bringing it to reversion to the mean.

If HYG falls suddenly or VIX futures pop, the arb is over and look out below.

The real movers though are the carry pairs, I haven't put up an Es comparison, but I don't need to, I can see it.

 USD/JPY, note it's  starting to move in a parabolic way and you know what happens shortly after that. Again, I think the target here is $104, they may hit a short squeeze so watch for that, but this is probably the most effective lever moving the market, but we know it's still short term as they are moving out of the carry, in fact the Yen's price action would make you wonder how the carry pairs even pulled this off today.

USD/JPY the same, so you can see what's driving the market, it's not demand.

I can see some rotation out of 5 year bonds, the notes yesterday were where the money was flowing to , so much so the yield went negative and people were paying to get their money out of equities, not sure where they are today, but the 5 year's yield is up so there's a little rotation to risk.

 The 5 min Yen, you'd think this would be a straight drop the way the carry pairs above look, but it's not and that's because there's demand here still despite the BOJ's efforts, the move is to coiver the carry, even if it's not at an advantageous price, they are apparently willing to take whatever they can get and that makes the BOJ's job difficult as each time they try to knock the Yen down, fund managers are buying the Yen back to close their carry positions, I was very surprised to see this price action in the Yen.

The 30 min Yen chart which has been driving it since the New Year low is still in line and powerful so no damage being done, as far as I can see, still lots of demand for Yen.

Finally just for kicks, the Context ES model. Note it was near 18 points positive, this was from the overnight carry pair move higher, now you can see it's down to the $8 point area as ES moves up to the model, it's not the model moving up, so once the carry pairs lose momentum, we should see this flip red.