Monday, June 27, 2011

XOMA Part 2?

 Todays price action in XOMA is exactly why I take double digit gains when I get them in a single day. If you exited at my suggested trailing stop, you made 25% on this trade today. You can always take partial profits and let some run, but make sure to take enough to guarantee a profitable trade. XOMA didn't close like I would have liked to see for follow through buying tomorrow, it closed well off its highs.

 There was a bit of a range that developed today, which is always interesting to me.

The 5 min 3C chart doesn't look bad in the range. I might consider XOMA for another ride should it be able to push past $2.70 on some good volume.

A Few Charts


BCRX (long)
 This is a daily chart, it's a nice looking base that looks like it's just entering stage 2 mark up

 BCRX 30 min

 I would set this as a limit trade with a buy order  >$3.90 and a stop around $3.63, of course you could also raise the stop to the $3.90 area, after all, once t breaks out, it should move up, not down.

CAT (short)
 I've posted on CAT several times. The lower red line is the eventual target.

 The 15 min chart is just not holding up well.

 Today's 1 min chart suggests some early weakness tomorrow. Even if CAT were to bounce with the market, I'd keep this on my short list.

CSUN (long)
 This hourly chart looks like CSUN has put together a nice little base to push further north.

 The 15 min chart suggests a pullback...

 The 50 bar m.a. on a 60 min chart, may be a little deep, but if it made it there, I'd certainly be interested in taking a look, otherwise the pullback may not be so deep.

CTDC (long)
 There's some interesting price/volume action recently

 The 60 min chart looks excellent, almost as if it could take off at any moment.

 The 30 min chart looks excellent as well.

NUE (long)
 NUE looks like it wants to bounce off this consolidation, perhaps to shakeout some short, but the move may be worth the ride nonetheless.

 The hourly chart looks excellent considering the price consolidation (usually signals are harder to see in consolidations).
 The 5 min chart shows what appears to be accumulation right at support, every time NUE hits it.

 I would consider a position here if NUE were to break the short term downtrend line around $39.60, a break of $40.40 and NUE should be on it's way to a decent swing trade.

Closing Stats / Miners Trading System

Today we had a very dominant Price/Volume relationship, it was Close Up / Volume Down.

Of the NYSE composite there were 3358 in the dominant relationship followed by Close Down / Volume Down at 1340 and Close Up / Volume Up at 1157. There were 809 stocks closing down on lower volume.

The Dow-30 had 26 stocks closing up on lower volume and 3 stocks closing down on lower volume; one stock closed up on increasing volume.

The NASDAQ 100 had 77 stocks closing up on lighter volume and a total of 13 decliners.

The S&P-500 saw 409 stocks in the dominant P/V relationship with 57 decliners.

The Russell 2000 had 1349 stocks in the dominant P/V relationship with a total of 453 decliners.

Typically Close Up/Volume down is the most bearish P/V relationship, but it must be looked at within the context of the current market environment. With all 4 averages below their main resistance level (which is the area the market backed away from last week when I said the market needed to pullback and regroup) there won't be a lot of confidence in chasing upside price moves and certainly we won't see volume rise due to short covering until the resistance level is decisively broken. Being this is the case, I'm not overly concerned about the P/V relationship.

The Miners Trading system is still long (both versions) NUGT. The 3% stop loss that is used in the system is at $27.41, today's close was $27.44.

Overall, there seems to be improvement in the technicals of NUGT.
 The 10 min chart shows a base-like formation with a breakout at the $27.50 area. RSI has a positive divergence as well during this time, that looks like a base forming.

 There was also a leading positive 3C divergence in the afternoon today as the triangle matures.

 The daily chart seems to be showing an extensive longer term base forming in the miners, so I'll also be looking at individual names in the group to see if there are any potential long candidates. As I have explained before, the miners are sitting on deposits of gold and silver and comparing the group's price to the price of gold (considering their deposits), the miner groups s trading at the equivalent of about $350 an oz. of gold, a substantial discount that may see some real investment interest, especially with the Dodd/Frank bill banning OTC silver and gold trading.

 Here's the 15 min. chart also showing some substantial improvement at an area that looks a lot like a base.

The 10 min. chart also looks bullish.

Back to the market....

The market actually held up pretty well considering some of the economic data today, such as the Dallas Fed's manufacturing index which came in at a huge miss. This data suggests as the trajectory of recent data suggests that ISM (Institute for Supply Management) when it comes out, will print below 50, which is contraction. All in all, the market took it in stride today.

We also heard from the Fed's Hoenig, a long time fiscal hawk. I mentioned his statements earlier today, but they certainly weren't what the financials wanted to hear. again the market took it in stride.

Also we had a Treasury Auction today of 2 year notes that DID NOT go well. The indirect bid came in at an astonishingly low 22% of the total, the loose translation could be summed up as "Who will be the buyer of Treasuries once the Fed winds down QE2?" Foreign central banks showed little interest in them today, leaving the Primary Dealers to clean up the mess, taking down 64% of the total auction and I'm quite sure they are none-to-pleased to be holding these notes either. Again, the market took it in stride.

In short, sentiment today was strong enough to lift the markets in the face of some not so encouraging news.

PLEASE DO NOT interpret what I have laid out above as a bullish perspective on the market. I've been looking for a market bounce in which to sell (short) in to. My primary view is that the markets are close to the second shoe dropping and if the first one may have been a ballet slipper, I believe the second shoe will be more akin to a steel toe boot. There's a big difference between tactical and strategic, a bounce n the markets is tactical, allowing us to sell short in a much better environment, the selling short the bounce is the strategic view. However we have to be vigilant each and every day, especially as the Greek situation winds up this week.

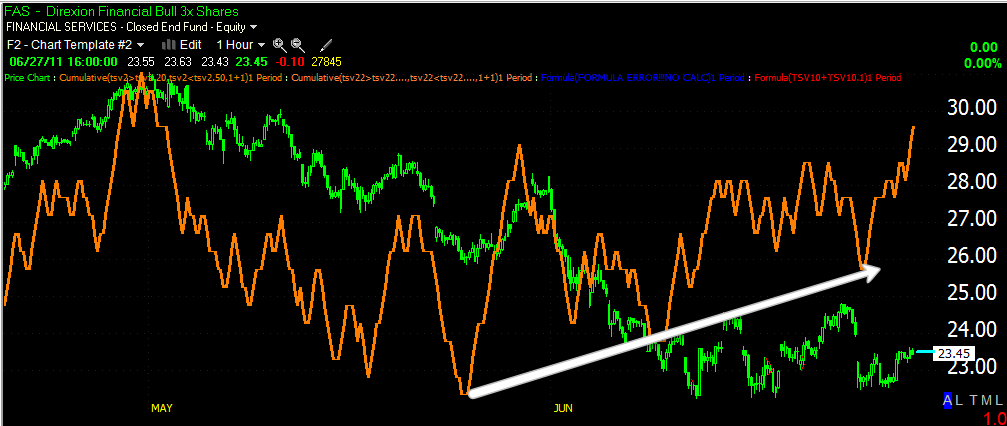
While financials may be showing signs of a bounce on an hourly chart...
 FAS-Bullish Financials on a 60 minute chart...

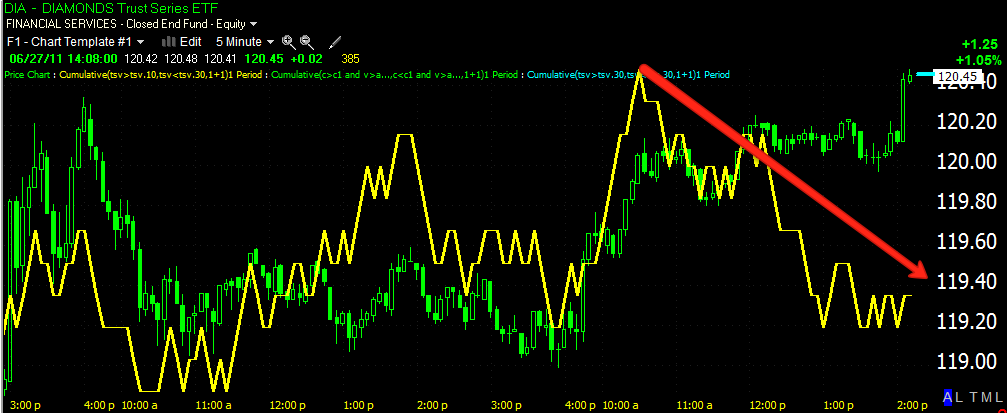
The big picture is quite different-(FAZ bearish financials on a daily chart). This daily divergence is much more important then the hourly divergence in FAS, it's longer, stronger and on  much more important timeframe.

I'm going to look through some miners and Chinese reverse mergers (a hot bed of fraudulent companies) as well as run some scans and take a look at breadth indications.

SPY Intraday Stop

If you are short term trading any of the market averages, the trailing stop I suggested earlier today (50 bar moving average on a 5 min chart) has just been hit on the SPY, QQQ and DIA.

Volume has picked up a bit on the break of the moving average

PMS Update

Both SLV and GLD look like they are prepping for a bounce as was my initial feeling last week and the initial data this morning.

 GLD 15 min

SLV 5 min.

AAPL

AAPL looks set to lead the pullback on the NASDAQ 100 which has outperformed the other averages today by a comfortable margin.

 AAPL 1 mn

AAPL 5 min

 The NASDAQ 100/QQQ right at resistance

 The DIA needs to move past the gap and through resistance

The same thing for the SPY.

For the maximum effect as far as a short squeeze goes, t would be most beneficial for all of the averages to break across resistance together so it's a broad short squeeze and not just a tech rotation.

URRE Follow Up

This is the last update on URRE from the 24th of June

I think the news I mentioned last night about the Missouri river flooding a US nuclear power plant may have put some pressure on URRE today, but this may be a chance to get in the trade at a lower cost basis.

 The 60 min chart looks to be very positive

 The 1 min chart is positive in to today's decline.

This is a speculative trade, but using the daily stop around $1.49, theres about $.09 of risk per share in the trade right now. I think that can be easily managed with proper risk management/position sizing.

Just something to think about, I probably wouldn't mention it if the 60 min chart didn't look as good as it does.

Resistance

This area of the gap of 6/23 is likely to get volatile. At the top you see the resistance from last week that prompted me to say the market needs a pullback before attempting to break out above that resistance which is key.

What we were looking for in the pullback was for a positive divergence, showing some strength to take on the resistance level around $129.80.
I think the pullback (in white around price) has accomplished what I was hoping to see. I think the market probably does have enough momentum in 3C to take on the resistance level. Intraday though we may see a pullback to take on this gap first. 3C has been suggesting that to be the case most of the day.

If the market can break the resistance level near $129.80 (SPY) then it may be enough to force the shorts to cover and send us up toward the 50-day moving average.

Market Update

 Although I'd love to see a market bounce, I'm skeptical of this mov, it's a bit too vertical and the 5 min chart is now negative as well on the DIA

 The QQQ 5 min chart is also negative

 The SPY is only negative to the 1 min chart.

 The TICK Index which has been stable all day just turned very volatile.

For short term trades, I would consider a trailing stop like this 50-bar moving average on a 5 min chart.

XOMA Follow Up

I know a few of you are still holding XOMA, I don't know if the rest stopped out at the trailing stop I put up earlier, if so, then you should have made about 25% today.

 This morning's trailing stop took you out at $2.80 for  25% gain on the day.

 Here's the current 1 min 3C chart for XOMA, it appears it may be trying to gain a foothold.

This is about the widest stop I'd consider if you are still holding, it would allow some more consolidation and still take you out at a profit on the day.

If the divergence becomes stronger in XOMA, I'll follow up, it may make for a good add-to or a place to initiate a position with a tight stop.

Financials and Hoenig

I think the Fed's Hoenig, didn't help financials with the following comments


  • HOENIG SAYS BIG FINANCIAL FIRMS PUT `CAPITALISM AT RISK'
  • HOENIG SAYS POLICY MAKERS SHOULD `GO BEYOND' DODD-FRANK ACT
  • HOENIG: SEPARATING PRIMARY DEALERS, BANKS WOULDN'T IMPEDE FED
Remember, this is a 1 min chart, mostly intraday action and in line with the broader market.

SPY Market Update

And there it is, this divergence has been building all morning.

Financials Update/FAS/FAZ

 FAS intraday is currently in a consolidation, it's not moving much like the averages since the last update in which some negative divergences appeared which has me thinking the run in the averages after the last market update, may be a false move setting up some downside.

 Here's the hourly chart of FAS which has been positive, but there also has been a trading range, this is what has me thinking that the market hasn't staged its bounce as of yet, but appears to have built up a large enough base that it could see quite a move. The timing of a bounce and the lateral trade may reflect a wait and see attitude with regard to Greece which will likely be the main driver of sentiment, especially this week.

 The 10 min chart shows positive divergences again near the lower end of the range. This is common accumulation price action, the position being accumulated is always accumulated at the best price point possible and when the stock/market runs up too far, it's knocked back down again keeping the accumulation range in place. This could be because they are picking up a large position or are waiting on a specific catalyst such as a news event, Greece would be the obvious choice, especially this week.

 FAS on a 5 min chart shows the same behavior as what we see above.

 The 1 min chart s largely in line with price and isn't giving any solid signal or edge as to the intraday direction from this consolidation.

 Here's the new version of 3C on a 30 min chart, also showing a similar positive divergence within the range. The second smaller red arrow is what I was talking about when the price gets too far away from the accumulation zone, they simply let some supply out and push prices back into the range.

Here is a comparative chart of FAZ (the opposite of FAS, FAZ is the bear ETF for financials), basically showing the opposite of what we see in FAS. Although the daily chart of FAZ is strong and implies that any bounce is likely to see distribution and a new leg down, likely to new lows. However, one bridge at a time.