Wednesday, April 22, 2015

Daily Wrap

Beyond concepts, Macro-Surprise Economic Index readings hitting fresh 6 year lows, the F_E_D and rate hikes, the scary event that is far more likely to have many more unintended, unanticipated consequences is Greece and it seems that the government there is getting no where fast with the requisition of local government surpluses sent to the Central bank (Soft Capital controls) as the next big IMF payment comes due and there simply being no way the EU or the Troika are going to come to terms with the Greeks before then...DEFAULT with spider web effects through the entire European financial system and abroad.

It seems the ECB is trying to pressure Greece in to making changes, but when has Greece ever made changes? The new government ran on principles they simply can't deliver on, thus yesterday's talk of the ECB looking to cut the value of Greek Central Bank collateral and essentially severely limit access to the ELA ECB Emergency funding (only a week after having increased it by $800 million euros), which is the ONLY thing keeping the Greek banking sector from all out collapse.

This morning's futures reflected the panic of that scenario about an hour after the European open when it was said the ECB would place a 50% haircut on Greek central bank collateral, effectively killing the Greek financial sector...
 At #1, ECB reports of cutting the value of Greek Central bank collateral sends futures plummeting, only official ECB denials shortly thereafter and the USD/JPY (positive divergences in both USD/JPY and ES) lifted futures at #2. Not to be a dooms-dayer, but even when they had a deal they didn't have a deal, I think this is a self-fulfilling prophecy and Germany is far more worried about it than they let on according to plans to fund Greece after defaults or transition them back to the Drachma. If you thought Lehman was bad....

It would seem to me that the gut feeling of a head fake move above a well known average and a VERY visible resistance trendline (SPX) based on numerous examples of the concept taking place approx. 80% of the time, that a head fake move was and is the most likely course of action as I said last night, although unlike past head fake moves, there have been no divergences to support the theory beyond the probabilities of concept...thus the strange action in 3C charts today off no significant divergences at all, just as we have thought the last several days...It would take some other lever.

 I hope you had an opportunity to read the 2 posts I wrote and have linked at the top right of the members site (all the time), "Understanding the Head Fake Move" parts 1 and 2. 

However there is another psychological factor in play, that of the attraction to whole numbers as the Dow regained 18,000, the SPX regained 2100 and the NASDAQ maintained +5000. I personally don't think this is the end game, but it is interesting that they keep reaching for those areas.

As for the averages, you might recall some ugly intraday IWM charts and our recent thoughts that transports would make an excellent second chance shorting opportunity if they'd bounce. Well as both situations would have it, the performance of the major averages intraday was interesting given the charts and the Transports trade set up (let the trade come to you).
The major averages intraday are within a fraction of each other, that's some of the best relative performance stability we have seen recently with Transports in salmon leading and the IWM/Russell 2000 lagging (interesting considering the IWM's charts from earlier which can be seen here, Market Update).

Volatility (up or down) is another one of the big things we have been looking for as this seems to always be the transitioning environment from one stage to another and 2015 can easily be called stage 3 top as flat as it has been and as I've pointed out, as many times as I have written that this or that average is green YTD or red YTD over and over again. The large triangles that are way too big to be consolidation/continuation triangles don't help, nor do larger topping patterns like the SPX's Broadening top which is much larger than just 2015.

As for volatility, I posted a chart the other day to show how extreme it has been on a day to day and intraday basis so that even with decent swings, it makes it VERY difficult for traders to hold positions for more than a day or so without some serious emotional dis-connectivity from the market.
Hows this for volatility, since 1 a.m. 750 points in swing in Dow Futures!

I believe I posted an example in last night's Daily Wrap or sometime yesterday (if you need the post email me and I'll get it for you) of the increases in volatility at each and every of the 4 stages of a cycle. This is why in addition to the 3 things I've been looking for since we made the April second forecast of a move higher have included : the 3C charts out to 15 mins going negative, which they have. The Index Futures charts from 7-15 minutes going negative which is more of a timing thing as the 60 min/4 hour charts are leading negative. Still the 7-15 min charts should not just be negative as they were in last night's Daily Wrap, but they should scream for the best timing. The 3rd thing was Leading Indicators, one of the last holdouts despite horribly negative 3C charts has been High Yield Corporate Credit (professional risk asset) it seems that this may have taken a turn toward our direction not only once but again today and likely more significantly as the charts are horrendous.

 HYG (blue) vs the SPX intraday, it seems the lever of choice wanted nothing to do with following or leading the SPX any longer and I suspect the late day weakness in the averages that likely prevented them from a breakout (SPX head fake) may have had roots in the collapse of HY Corp. Credit as a short term ramping lever as it gave out.

 Note the positive HYG leading signal vs the SPX (green) around the 8th/9th and then negative dislocations at each of the highs and an overall rounding reversal process in both assets.

As for the charts, the trend of this 2 min chart should be very obvious as to distribution in HYG, it can't hold itself up with sellers pounding it like this which has gone from a large relative negative divegrence to a recent leading negative divegrence.

As mentioned, HYG is already in a primary downtrend and here you can see each of the negative 3C divergenceS sending it lower, the most recent is by far the largest and this is a very strong 60 min chart. Remember the general concept is, "CREDIT LEADS, EQUITIES FOLLOW".

There were some short term leading indicators as posted last night and again today , being careful to make sure you see the larger picture in them too, Yields for example have been supportive locally, but dislocated negatively on a big picture basis. They still seem to be offering support, thus I still suspect a head fake move is in the cards, but today's market action just wreaked of struggling to swim against the tide.
 As shown several times yesterday and today, it looks like 5 year yields were supportive as the market found footing at the 2 pm lows which I suspected would play a near term role and then again, look at yields leading as the market makes intraday lows this morning.

The long end has seen a 14.5 bps gain over the week with +8.5 bps alone today (as you can see above the more aggressive move in yields). Remember yields act like a magnet for equity prices. With the long bond having the worst day in 7 weeks and yields at 5week highs (just about in line with the April forecast/cycle, I'm not sure how much longer they'll be supportive which may be why we saw some strange, what looked like desperate action in the market with 3C signals I have rarely sen and Eric from NANES confirming ES futures spoofing around noon time. Again, smells like desperation in a market that would rather sell price strength, even though a head fake move is like a basket of candy for Wall St. packed with goodies on the way up and the way back down.

As for other Leading Indicators, our custom SPX:RUT Ratio...
 shows non-confirmation vs the SPX today...

Specifically in the afternoon it got more ugly than you realize looking at the chart above this one.

And since the April 2nd forecast, the leading designation in to early April was a big part of the analysis for the April 2nd forecast, but since it has failed to confirm and this has been an exceptionally effective indicator for us both intraday, next day and longer term like this in a cycle.

Commodities look like they are turning as well as mentioned last night...
 Commodities which have started working again as a leading indicator since the end of QE and the last couple of days dislocating vs the SPX.

On a larger scale trend through this year, you can see the signals and the current negative dislocation, thank you China!

 HY credit was in line as it should have been after the 4/2 forecast at the mark-up stage, but turned down at the reversal process (stage 3) area and continues to move lower.

Interestingly for a day when levers are applied to the market, the VIX is often one of the first to be whacked, but as shown yesterday, unusually strong positive 3C signals have been gathering the last 2-3 days in VIX futures as well as VXX/UVXY.
 VIX futures intraday.

Migration to a stronger 5 min chart and this goes on all the way out to 60 min charts in a mere 2-3 days which is impressive and looks like deep pockets bidding protection.

As for the averages, I showed and mentioned above the IWM's intraday negative divegrence/distribution...
 After an early morning selling event/capitulation short term, IWM saw accumulation at the level and then saw distribution in to the afternoon.

However, although it was the poorest relative performer, it was not the only average to show this behavior in to strange divergences today that just looked like money being thrown at the market to push it above resistance rather than the normal accumulation process, very odd.

 SPY saw intraday distribution in to the close

As did the Q's.

You already saw the VIX futures accumulation during the same time.

As for USO, you may recall yesterday's update, USO Update-Swing Position,  looking for a near term bounce as a second chance position for those interested, I think that's still in play.
 The shorter term 5 min chart suggests we have seen near term accumulation yesterday and mostly today, however this is subordinate to the stronger 10 min chart with a larger divergence...

10 min USO leading negative, Translation: Short term bounce, larger move to the downside.

As for Internals today...

The Dominant Price/Volume Relationship among the component stocks of the major averages were all dominant today unlike yesterday, the Dow had 14, the NDX 51, the SPX 198 and the R2K didn't have a relationship.

Once again it was Close Up /Volume Down, the most bearish of the 4 relationships and as a 1-day bias event, usually the next day closes lower, but in this case it could be as I said Monday, reflecting the weakening market as it tries to break resistance.


S&P Sectors saw 9 of 9 green which argues for a 1-day overbought event, similar to the Dominant P/V relationship. The leader was Tech at +1.02 and Consumer Staples at +0.06%.

As for the 238 Morningstar groups, they too are near a 1-day overbought event, but not quite there with 174 of 238 closing green. The market still feels like it's not done and in looking at watchlist trade set-ups, many of them feel like they are not done so I think my overall feeling is the same as yesterday, even though there's not strong 3C evidence for the set up of a head fake breakout move and there's very strong evidence for the failure of one, I believe the probabilities of the concept are very high and this situation makes them even higher with such defined resistance that traders will chase in such a well known index as the SPX. Mean time, protection continues to be bid, I'll try to get a VXX/UVXY update out tomorrow as you'll see it there too and Leading Indicators like HY Corp. Credit which have been the last to diverge are doing so now, if there were to be a head fake breakout and HYG continued to diverge, that would be the typical strong Leading Indicator signal that we have in so many other indicators, Yield need to turn as well in my view. Until then, I think patience is still the best policy lest you get chopped up in a wave of large swinging volatility. Let the trade come to you, let it be on your terms at the time of your choosing with the confirmation that gives you a real edge. BELIEVE ME, I'M MORE ANXIOUS THAN ANYONE FOR THE NEXT PIVOT AND POSITIONING, BUT KNOWING WHEN AND WHERE TO PICK YOUR BATTLES IS MANY TIMES THE BIGGEST EDGE YOU HAVE.

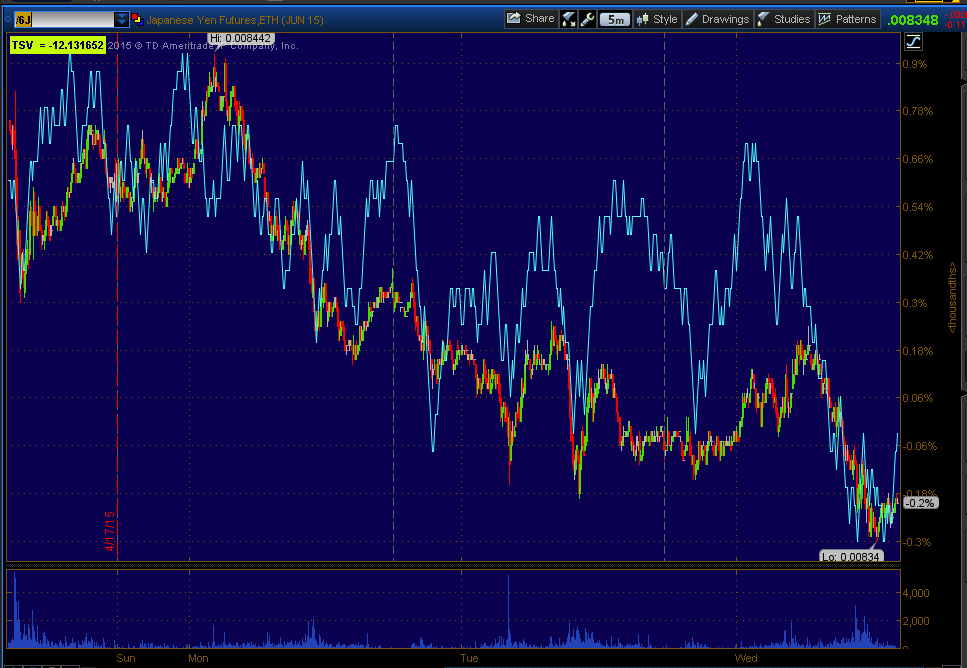
As for futures, as always I'll check them again later tonight, but the USD/JPY more or less did what was expected on a negative divegrence and pulled back a bit, then added some additional gains and is still negative or showing distributive signals.
 USD/JPY 1 min. Although negative, it's not screaming negative and after looking at near term $USD and Yen, I think it can hold up overnight, maybe lift the market tomorrow for another shot at the SPX's resistance?

It does matter as you see...
ES in purple vs USD/JPY in candlesticks, the white box is the European open, USD/JPY virtually rescued Index futures.

As I mentioned last night, the process of migration is still a concept that we should see, so considering I'm looking for strong Index future negative signals in the 7-15 min timeframes, tonight's 5 min charts in ES and NQ are very interesting...
 ES 5 min with previous negative signals sending it lower, but this leading negative is the kind of signal that I would call "Screaming" or jumping off the chart.


NQ/NASDAQ futures are similar.

TF/Russell 2000 don't look as extreme, but there was little to sell in to in the R2K today as well. These signals have migrated to longer charts as posted last night, although they can develop pretty quickly in these timeframes. When the 7, 10 and 15 min charts look like this, I'd have no choice but to call the pivot.

All of the averages are right there at their respective head fake breakout points, all of the indications point to a false breakout and excellent positioning, it just needs to get done, set the positions and move to the next swing.

Have a great night.

Pre-Daily Wrap

First, I'd like to welcome all of our new members to the pack. I'm very grateful to have been given the opportunity to share what we do with you and hopefully you'll find it useful. Always feel free to contact me any time.

Today has been one of those days in which I feel like a 1-legged man in a butt-kicking contest. There are so many assets, indications and trade set-ups to check while trying to put together what's actually happening and what that means to our strategic and tactical plans moving forward.

I have quite a bit to cover tonight, but the Daily Wrap will be out as it is every night.

Earlier I alluded to today's situation which I'll elaborate on more later, it is very much within the realm of recent expectations and long term concepts that have proven very effective.

Specifically I wanted to get to something that was in last night's Daily Wrap . These are excerpts and the entire post can be found at the link just above. The bottom line from last night's Daily Wrap as well as numerous posts within the day was that there was no strong technical/3C accumulation reason to look for a head fake move above different technical areas that attract a lot of attention, I've used the SPX daily chart and its March trendline that has acted as resistance numerous times now, as an example of the broad concept.

While I could not point to the kind of positive divergences or small bases that would lead such a move or an attempted move as I believe we saw today in to a weak market, it's the "Head Fake concept" which I estimate takes place 80% of the time before a significant trend reversal and this in any asset and any timeframe. For more on the "Head Fake", there are two articles always linked at the top right of the member's site:

Understanding the Head-Fake Move... How Technical Analysis Went From an Asset to a Trap

and

Understanding the Head-Fake Move... Motivation

So I'll let you read the excerpts, but the bottom line was there were no divergences that would support such a breakout / head fake move above the SPX March resistance trend line, however despite that, some lever would be used as the concept is so strong and in this case so incredibly obvious, so easy and at the most pivotal areas of all of 2015 and probably well beyond and I'm not one to rely on gut feeling.

Here are yesterday's Daily Wrap excerpts, considering the odd behavior in the market today:


"I'll just say broadly that my gut feeling is that we see a SPX head fake move for reasons I have laid out for years and more recently, numerous times over the last several weeks as the March SPX trendline became more obvious and as the resistance at the trendline became more numerous.

We have tagged this trendline's resistance so many times, it's a perfect set-up, it's free money for smart money, it's easy last minute dumping of a lot of shares without anyone questioning who's on the other side of the trade. My gut says, "It makes sense", if I were the crooks with the invisible hand, that's what I'd do.

Today's SPX closing chart, another test/failure at March SPX trendline resistance.

I've explained as best as I can the head fake scenario, the probabilities of it which in this case would normally be very high and the lack of Evidence to create the scenario, still we're not that far away from the trigger that would hit limits and get breakout buyers chasing the market, thus creating the head fake scenario without any investment from Wall St. In addition in the Leading Indicators update, I showed you how pros in HY Credit are going the other way, but I'm still leaving this scenario very much open as it would be a fantastic tactical entry and a great timing trigger for a downside pivot of this move that is essentially exhausted as it keeps crashing in to SPX March trendline resistance with just about everything we were looking for having turned already.

MY LAST POST, Quick NFLX/Market Overview GAVE THE PROBABILITIES BEST AS I CAN GAUGE THEM NOW WHICH IS TO SAY THAT INDIVIDUAL WATCHLIST ASSETS LOOK VERY CLOSE, BUT ARE MISSING THAT FINAL POP, WHICH IS PROBABLY THE BEST CASE THAT CAN BE MADE FOR A HEAD FAKE MOVE BEYOND THE HIGH PROBABILITIES OF THE CONCEPT ANY TIME IN ANY ASSET.

 Here's an example that I think distinguishes the probable short term from the highly probable bigger picture...
 DIA 1 min intraday and a positive at the 2 pm lows, the "toe hold" I suspect the market will try to work form.

And the bigger picture, but not so far away that it's irrelevant, it's very relevant.

DIA 15 min chart, remember the 15 min timeframes were all positive (except the IWM) in early April, now look at the DIA's 15 min leading negative divegrence, it JUMPS OFF THE CHART, THIS IS THE KIND OF CHART I DON'T IGNORE.

IF I'VE DONE MY JOB IN EXPLAINING WHAT WE ARE LOOKING FOR AND HOW THINGS HAVE PROGRESSED, THEN YOU KNOW WHAT THE IMPLICATIONS OF THESE CHARTS ARE AND WHY IT'S DIFFICULT TO CALL FOR A HEAD FAKE MOVE, BUT THIS IS MY GUT AND THE CHARTS, IT DOESN'T END WELL FOR THE MARKET."

Market Update

I can't wait to get to yesterday's comments with regard to today, there's just so much to keep track of right now that I don't have time until after the close.

The market truly looks like it's straining to get this move off.

USD/JPY has been trading sideways since the intraday highs at 11:50 a.m.

As for intraday breadth, the TICK as of a few minutes ago...
 Remember yesterday's suspected "toehold" for the market to build something off of to the upside at 2 p.m.?

And this morning's flameout around 10 a.m. with TICK breaking the channel, but never really hitting any extremes, all under +1250 and since...

TICK has turned down (number of NYSE advancing stocks less number of declining stocks), right now TICK is closing in on -1000, intraday market breadth is falling apart on what is clearly a manipulated move as more or less expected from recent comments with the finest point put on it yesterday in the Daily Wrap.

 The 3 min trend of the QQQ is showing an overall distribution process from the April 2 forecasted trend as well as the reversal process and today is looking a lot like the "Chimney" in our "Igloo w/ a Chimney" topping reversal pattern, but what is really strange is the leading divergence to the far right which has no supporting base area or supporting divergence (positive) which was also part of the timely comments from last night as there's 1 goal here only, break above the SPX March trendline, I have no doubt it will be a head fake move/bull trap, but it seems they are having a tough time and that's even with outright manipulation NANEx has documented from the afternoon which makes some sense as to these very strange intraday signals.

Now compare to the IWM intraday chart below which makes a lot of sense...

 A positive at yesterday's 2 pm flameout but it's still small and on a 1 min chart. An additional larger positive with yesterday's at this morning's lows and selling capitulation event intraday which also makes sense and the move up in IWM which is proportional to the divergence since 2 pm yesterday. Since then a negative divegrence has set in and the IWM is losing momentum and turning lateral

In other words, even with all of this odd manipulation, the market is struggling to make a clean break.

 Here's a more contextual view of the intraday IWM 1 min chart seeing distribution in to higher prices.

And even stranger (under normal circumstances-you have to recall we saw this yesterday and very strong),...
VIX Futures continue to be under accumulation today during this breakout attempt which is what we would have expected from a head fake move, protection as it tends to be the last event before a major price reversal, again in this case down.

I'm going to try to get to Leading Indicators.

APPL has FINALLY made the move we had been expecting based on the triangle. Some other assets like NFLX and others on the watchlist look like they are getting ready to make the upside move I'd like to use to let the trade come to us (short), so I suspect this entire episode is not over.

After looking at all of the charts over the past several weeks , today does make sense, even though there are strange circumstances and the market is still struggling even with the "extra" support.

I have virtually no doubt that "if" they can pull this off, it is the head fake move that leads to the primary trend reversal in the market.

Unusual Market Activity-I Wonder Why...

We've seen some slightly unusual market activity as of earlier today with USD/JPY sponsoring ES / SPX futures with a divergence to run up USD/JPY about 4-5 hours before the US cash open.

Additional strange elements today have included the fact that THERE HAS BEEN NO POSITIVE DIVERGENCE ON ITS OWN TO LIFT THE MARKET, HASN'T BEEN ALL WEEK, MAYBE LONGER.

Then some strange 3C charts, such as...

 This intraday move looks a bit suspicious off a divergence so small. You may recall what I said yesterday in the Daily Wrap, after the close I'll pull the exact text but the gist was, "There's really no support for an SPX breakout, yet the concept of a head fake move is so strong, I believe they'll find some lever to make it happen.

The move is also highly suspect when it comes, which is close, as a head fake move/bull trap.

Last night's comments could not have been more appropriate or timely.

Other strange charts...

 This odd 3 min SPY leading positive, but it has no process whatsoever, no divergence earlier, it looks like someone has simply push cash in to the effort of creating the SPX breakout.

Intraday Index futures are more or less in line/confirmation, however one of the few people I follow on Twitter, Eric Scott Hunsader of NANEX confirmed "Odd behavior " in the E-mini contract for about an hour around noon time.

There have been even odder charts and while new members may not recognize them as unusual, most of you likely will. Tell me, when is the last time we saw a divergence like this...
 A 5 min leading divergence in IWM with no intraday charts migrating to it and on such a small dip intraday. The first divergence at the white arrow is believable, the second that is leading is highly unusual.

The same chart without my scribble...
IWM 5 min and realize that the overall chart is in a leading negative position.

Why? Exactly as was said last night, I don't know how they'll find the market strength to pull it off because it's not there, but the concept is so strong, it's high probability...

SPX daily...
And that's what it's all about.

However keep in mind that in to this probable breakout/head fake move, Protection is seriously bid a posted yesterday and continued today.

You are seeing market manipulation at its finest, I'm sure NANES will put out a graphic on the spoofing and all the other stuff going on in the E-mini today. At least we are getting somewhere now, I doubt the market will be able to hold it long, lets see if retail bites.

MCP Update

Our last post on MCP from April 15th, MCP "Patience Pays?" seems to have given us the reason we had been seeing those long term accumulation signal. I doubt a 10-year deal with Siemens is something that happens overnight and I doubt it's something that stays utterly quiet, thus the longer term divergences.

However since then, we've had a pullback at resistance of what looks like a "W" base bottom.
 MCP daily chart hitting resistance at a "W" base breakout/resistance area.

This is the 60 min chart and leading positive divergence (a very strong signal on a strong chart/timeframe) at the second "W" base low and the trend since. I'd personally like to see a leading positive divegrence on this chart before I felt strongly and comfortable that it was ready to take on resistance and break out to stage 2 mark up.

However, there are some near term charts suggesting something is building, even if it may not be the breakout that I suspect MCP will eventually make to stage 2.
 MCP 3 min shows the negative divergence at resistance, the pullback and a flat range where we often see accumulation / distribution leading positive.

This has migrated over to the 5 min chart as well.
 The same negative at recent highs and a positive relative, almost leading divergence in the same area.

My gut feeling is that MCP will see a bounce back toward the resistance area and likely not breakout. The other scenario is that this divergence continues to build, continues to migrate to longer term timeframes and does make a break out move, the reason I lean more toward the first probability is the 1 min chart which tends to show timing signals.

1 min MCP.

Personally I'd feel best about a trade in MCP long "IF" there were a shakeout below $.70 level on high volume, a clear positive divegrence as that would give us an entry at lower risk, a better price and a stronger timing signal (head fake/shakeout).

I'll set price alerts for such a scenario, otherwise I'll keep monitoring the divergence and see if it builds more from here.


Intraday Deterioration in USD/JPY

From today's earlier post on the USD/JPY vs. ES/SPX futures, Very Early Update it seems the intraday USd/JPY charts are seeing more deterioration, this may lead to an intraday/short term move lower.

The 7 min charts that are still very much in line with higher USD/JPY are still in place and I would suspect that if we saw a USD/JPY intraday pullback, it would likely make another leg higher unless/until those 7 min USD and Yen futures charts start to fall out of line and diverge.

 1 min USD/JPY (candlesticks) vs ES/SPX Futures, as we saw earlier today the USD/JPY picked up sponsorship of Index Futures / ES and they (ES in purple) and lifted them , they have been largely in line since.
There were some signs of possible trouble brewing in USD/JPY, although there was no divergence in the pair itself earlier this morning (see the post linked above). The hints of trouble were in $USDX and Yen futures independently.

Since then...


 The USD/JPY has put in a sign of trouble with a negative divergence recently (the earlier positive that lifted the pair and index futures which started about an hour after the European open, can be seen to the left in white).

 This is the 1 min $USDX chart, you may remember earlier it already had a negative divegrence suggesting a weakening $USD which would likely lead to a weakening $USD/JPY and as it is sponsoring Index futures...

 At the same time for USD/JPY to come down, the Yen would need to lift, this is the 1 min positive divegrence in Yen futures which has grown since the earlier update this morning.

It's difficult to say if this is just going to possibly lead to a pullback and then a leg higher in USD/JPY or if this is going to become a stronger and stronger divergence and knock it down and end of story.

The 7 min charts are the line in the sand, you can see them in line again at this morning's earlier post linked above, they still look the same, however...
 There has been some migration or strengthening of the $USDX negative divegrence as you can see hints of it on a stronger 5 min chart (the concept of migration of a divergence to a stronger timeframe-stronger divegrence).

For now, we aren't seeing that in the Yen 5 min chart, it is still in line to the downside, pointing to USD/JPY future strength even if there's a pullback.
Yen 5 min still in line and not seeing a stronger divegrence.

For now, I'd say we can't assume too much, but based on what we have right now, a pullback or consolidation short term/intraday in the pair looks more and more probable and for the moment, so does another leg higher.

I did want to mention that there's still a bid for protection. You may recall yesterday's Quick Futures , too large to be retail. They are still building so it seems someone is getting ready for something. I'll update VIX futures and VXX in a few minutes as long as nothing else comes up.

Market Update

It's always the dull markets that are the dangerous ones. We're seeing more activity, even if not outright in prices.

Take the NYSE TICK for example...
 TICK was dull this morning in a narrow range until a mediocre move at -1000 at intraday lows, but that shot up to over +1350 which is an extreme before trending in a channel as the market was largely lateral at that time.

There has been a little more excitement in TICK since, but it's subtle and looks like it may be coiling some energy for a move above that channel.

Remember yesterday's 2 pm mini flameout and suspicions that might be a toehold for a head fake move higher? Here's a more appropriate example this morning in SPY on increasing volume (10 min) and a bullish Hammer, short term selling event. This is where a small, almost insignificant divergence formed (positive), under normal circumstances I don't even know if I'd mention it, but since there has been a lack of anything in recent days that could lift the market, any change in character at this point is worth mentioning.

 DIA this morning saw non-confirmation intraday on 1 min 3C charts just like the rest of the market, but note the positive at the morning lows and mini intraday capitulation event mentioned above.

Since the 1 min chart has been largely in line with price action. This is NOYT the kind of divergence that would support a strong breakout move which is what a head fake would need to be, at least not on its own without some other levers.

 The 2 min chart which is slightly stronger shows yesterday's 2 pm mini flameout, the area I suspected might be a toehold to try to get something together. As you can see, this morning's intraday lows and mini flameout put in a stronger positive divegrence and a slightly wider one now.

Just don't forget the highest probability resolution, as posted last night and again as a reminder, the much stronger DIA 15 min chart.
 Like all of the other averages it was positive at the 4/2 forecast (except IWM) and has since gone to a deep leading negative divegrence. This is not to say a short term move can't break above resistance areas and even be impressive, this is to say the probabilities of that move being anything other than a head fake are very low and its ability to hold gains are very low, it's more likely to be the pivot point that head fakes often are.


SPY intraday is similar, the opening gap saw no confirmation and a slight positive at the a.m. lows.

This is more or less what most of the averages look like for the most part.

However once again, yesterday's 2 p.m. lows figure in to a larger positive divegrence at this morning's lows as suspected yesterday.

The market still needs to put in that head fake move for it to be useful, other wise we are gathering data and waiting on trades to set up, but once again we are probing that area in the SPX making it more obvious and more likely that we do get an upside head fake breakout.

SPX daily probing resistance again, it's way too clear, way too obvious to believe it's not going to see a head fake (false breakout), I'm not quite sure it will be able to hold it long all things considered, but we'd have to see what the charts look like at that point.