Tuesday, November 1, 2011

It's past 2 a.m. in Greece

And a hard working G-Pap has emerged with the following:


  • GREEKS TO VOTE ON EURO MEMBERSHIP IN REFERENDUM: PAPANDREOU - BBG
  • GREEK PM SAYS PARTNERS WILL RESPECT AND SUPPORT GREECE'S EFFORTS -RTRS
While, Netherlands Will Try to Get Greek Referendum Canceled, PM Says

Does everyone realize what G-Pap is trying to do? He IS for the bailout, however with the strikes and civil disorder in Greece, he has basically said, "You know so much, then you make the decision".

If the question is framed, "Do you want this bailout?" the answer will be no

If the question is, "If we scuttle this bailout, we will be kicked out of the EU, is that what you want?"
Then the answer will be yes.

However, the G-20 set a deadline for the EU to resolve this crisis by this week's meeting and beng the vote isn't until January and depending on whether the Troika issues the next tranche, Greece could already be in default by then.

Like I said yesterday, I'd love to be a fly on the wall at the G-20 summit, it is surely going to provide more fireworks then the first Finance ministers meeting last Sunday.

Like a Charm

The last update at 6:55 showed ES with a leading negative divergence and the last thing I said, "I would expect more downside on this leg"

30 minutes later...
The red trendline is where we were last update, and now 5 ES points lower!

Had we traded 1 single contract the profit would have been $400 for 30 minutes of waiting.

After Hours ES

I am sure happy to 3C/ES back up.
1) Pre-market positive divergence sends ES higher off the open
2)negative divergence at important resistance sends ES lower
3) Before the Greek-no referendum announcement, 3C accumulates sending ES higher to resistance again
4) a negative divergence sends ES lower in to the close
5) The EOD lows are accumulated and ES moves higher in after hours
6) a negative divergence on the after hours highs starts sending ES lower, there's a continued leading negative divergence, I would expect more ES downside on this leg.

Chasing News and the Latest Headline

This is when it really helps to have a news service like Briefing.com (I'm not an affiliate for them).

We are in the land of news driven markets, at least on an intraday basis.

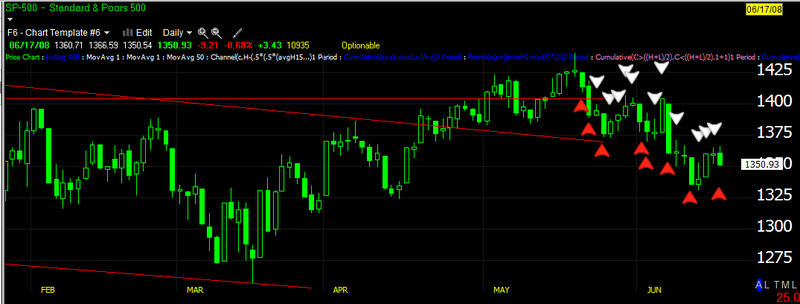
I don't think this chart should be ignored and it is not daily headline based.
While the recent highs were only about 5% off the highs depicted to the left, 3C is at a new low for the entire period.

As far as the daily gyrations and news, I would guess the news count is something like 20 times normal-just during market hours, throw in 24 hour and probably more like 40-50 times normal and these are big headlines, not just the Oil Inventory report.

On the last post I showed you today's intraday parabolic move up which was based on the news that there would be no Greek referendum and the parabolic move down is based on the latest news that the referendum WILL go through-sending the market lower in to the close.

We have the FAD tomorrow which will introduce a whole new level of volatility and remember that the knee jerk reaction is almost always wrong.

When I was trading exclusively for my livelihood, I had the "experience" of trading through the Bear Stearns/Lehman Brothers market. What I can tell you is that the market right now is very much like the market back then, except I would say the stakes are much higher now. So get ready for extreme volatility, get ready for indicators that you trust no longer working (3C should be fine as a money flow indicator, but momentum based indicators and oscillators will go nuts).

I'm featuring a lot more news then normal and believe me, I'd rather not, it's an additional burden, but it is important to what we do at this stage in the game. For instance, when we received the details of the bailout, cursory examination of the deal showed it to be full of holes, it wasn't hard to predict the Chinese would back away from such a messy plan. It also punished Greeks, especially their pensions so it was not hard to predict that they would not be happy, nor was it hard to predict that the other PIIGS would look to take advantage of the bailout to negotiate better terms, so the news I feature is not for entertainment, I'm far too busy for that, it is for thoughtful insights that should help us put more pieces of this insane puzzle together. We are going to need every edge we can find right now.

As bad as the trend down was in 2008, there were huge countertrend rallies, these are opportunities, but we need to identify them as soon as we can. I'm always open to hearing your opinions and to receive links to news I may not have seen yet.

If this is as it seems, the start of chaos like 2008, we'll have a lot of opportunities, but we need to work extra hard for them.

So the latest is, the referendum is back on.


Today's Close

Today's close looks to be a Doji, con't be surprised to see some upside off this close tomorrow.

One more reality

You often hear me talk about parabolic moves... Try to understand that what rises in parabolic fashion, usually falls in parabolic reaction. It's just something to understand to help keep emotions in check during stressful periods.

 Intraday today on the SPY

2-day trends on the SPY

Reality

I mention this every once in a while, but it's worth noting right now. Did you know that in a bear market, there are usually just as many up days as down days? Some times more!

Here's the comparison period in 2008 that I have shown to be very similar to now.

 This is from the point of breakdown, which we might say correlates to Friday-Monday of this week. This is a 5+% loss that you are viewing where all of the arrows are, but there are 11 up days in white and 8 down days in red, more up days then down days, yet the market still lost over 5% in this period.
What happened next?

This is a measurement from the equivalent of the Monday top to the bottom, a 50+% loss, yet note the counter trend rallies and probably more up days then down.

I mention this now just so everyone is realistic about how the market behave, even during one of the worst falls we have seen in the last few decades. Keep your eye on the trend and don't get lost in the lines.

I don't post this to say this is where we are heading, just to make a point about the reality of the market, nothing goes straight up or down. Like I said last night, to trade, you must b able to tolerate a certain amount of ambiguity, otherwise, everyone would win and the winnings would = ZERO.

USO Update

Several months ago USO was very difficult to get a read on, that seems to have reversed and USO seems to be one of the easier ETFs to get a read on, the reason? I believe that USO is reflecting sentiment regarding the Euro and a likely plunge in the Euro.

 USO and the important breakout level it crossed and then crossed back under. It is so far above, but we'll see where the close lands us as USO is strictly being driven by FX today.

 As we have seen a lot recently, USO is jumping ahead of the Euro in red and the Euro tends to be the leading indicator suggesting that USO will follow the EUR lower.

 The 1 min chart is showing distribution, notice there was no accumulation today at all, the entire drive was Euro/Dollar driven.

 The 15 min chart moved a bit, not enough to be in line intraday, but zoom out and...

 USO is showing what looks like a sloppy top, the accumulation for the this last rally is very similar to the SPY.

I know there are a lot of signals here, but they have been very accurate, white=accumulation, green=trend confirmation and red=distribution. USO is leading negative. I don't think USO will stay above that important trendline for long, but we can't ignore the very obvious, it is following the Euro as that is where the fundamentals of value are (via the dollar) and news is unpredictable at this point, but the fact that it looks this negative seems to suggest that there is a loss in faith of the Euro moving forward.

This may not help the second market rally attempt

These are charts of the FXE (Euro).

 The FXE 1 min which has seen confirmation through today's market hours rally is now leading negative.

As is the 2 min chart.

Remember that Euro strength is supportive of the market.

Update-As best as I can

This is one of those weeks where the fundamentals change so fast and are so unpredictable, that following the short term charts is about all that can be done. There's about 0% chance smart money knew G-Pap would call for a referendum when his own finance minister didn't know, there's less chance they knew there may be a coup brewing a the military in Greece is reshuffled. It's one of those weeks that again, is very reminiscent of Lehman 2008.

 DIA 1 min showed the positive divergence the earliest and now we have a negative, whether it is a consolidation or a reversal is hard to say, we are near resistance in some of the averages.

 The DIA 5 min seems to show this latest attempt having less underlying velocity  and is negative.

 I finally (through the help of a good friend) got my 3C ES back up and running, this shows all the move today and has a relative negative divergence from the earlier leading positive that got the rally started.

 IWM 1 min shows the accumulation for the move up and is negative here.

 The 2 min is even more negative

 QQQ 1 min wasn't looking all that strong earlier, it looks the weakest now

 And the 2 min is negative as well.

 Here is the SPY vs the Euro (red) and as you can see, the SPY has been held up by resistance while the Euro has made a new intraday high. I'm guessing that this is more risk off related then anything as the correlation between the two is usually nearly perfect except for the last few days.

 SPY 5 min is relative negative.

The TIK chart which shows an uptrend around the 2nd intraday rally is now getting volatile and looking as if it may break the up trend channel as we are at S&P resistance.


Update

Certain elements of 3C were warning that we may see an intraday move higher in the last update and here it is...

The catalyst this time? Dow Jones News cited socialist party officials in declaring, "The Greek PM's Referendum Call is 'Basically Dead'!""

Greek Coup?

A few days ago I posted Greek sentiment toward Germans and I assume German citizens don't feel a lot of sympathy for Greeks, in fact regional elections have shown Merkel suffering badly because of her support of the EU/Greece.

There were some disturbing elements to that post such as Greek hostility toward German tourists. I ended the post saying that I hope there isn't an escalation leading to violence.

Well I may have missed the mark as the Arab Spring, the Occupy movement and others have emerged as a theme of 2011. Now with all of the sudden changes in Greece over the last 24 hours, we have this from Athens News:

Top brass replaced


In a surprise move, the defence minister proposed on Tuesday evening the complete replacement of the country’s top brass.
 
At an extraordinary meeting of the Government Council of Foreign Affairs and Defence (Kysea), which comprises the prime minister and other key cabinet members, Defence Minister Panos Beglitis proposed the following changes to the army, navy and air force and the general staff:
  • General Ioannis Giagkos, chief of the Greek National Defence General Staff, to be replaced by Lieutenant General Michalis Kostarakos
  • Lieutenant General Fragkos Fragkoulis, chief of the Greek Army General Staff, to be replaced by lieutenant general Konstantinos Zazias
  • Lieutenant General Vasilios Klokozas, chief of the Greek Air Force, to be replaced by air marshal Antonis Tsantirakis
  • Vice-Admiral Dimitrios Elefsiniotis, chief of the Greek Navy General Staff, to be replaced by Rear-Admiral Kosmas Christidis
It is understood that the personnel changes took many members of the government and of the armed forces by surprise. (Athens News)

This certainly isn't an austerity measure. Lets hope this is not leading the way G-PAP and his Defence Minister seem to be planning for.


Market Update

It's been relatively quiet so far today other then the opening, we did see similar action yesterday with the close giving up the most in terms of percentage loss on an intraday basis, however this could also be some calm before the FOMC meeting, we'll have to see.

 SPY 1 min is entering a slight leading negative divergence here.

 I would call the 5 min in line, with a slightly positive reading right now, but as it stands, the 1 min moves will be most important and then as they bleed in to longer timeframes those will be more important.

 The close up of the 15 min shows continued deterioration in the form of a leading negative divergence, the box in red is today alone.

 This is the same chart zoomed out showing the last 2.5 days of leading negative divergence in the SPY, which is greater then any other leading divergence on the chart, positive or negative.


 The 30 min chart is leading negative since late Thursday and making new lows, showing Thursday as what it appeared to be, a chance to sell/short in to strength on a false breakout.


The short term DIA looks a bit different, the sector chart showed industrials stronger then financials, so the DIA looking better isn't surprising vs the S&P, but the difference in the divergence is a bit surprising, we'll have to see if the DIA can move off this divergence.

 The longer term 30 min chart is also like the SPY leading very negative.

 Short term 1 min QQQ shows a slight bit of positive divergence currently so it will be interesting to monitor, it is relatively new and not all that well formed yet, so whether it continues or is just noise remains to be seen,

The longer 30 min QQQ chart again looks like the others.

 The IWM isn't giving any hints yet as it is in near perfect confirmation short term

Of course longer term it is hitting new lows-leading negative.

I'll take a look at some other charts to see if anything pops out, right now is strangely quiet.

Sector Rotation

Here's the sector rotation for the last 3 days, not too surprising, Financials have taken the biggest hit followed by Energy, while more safe haven sectors like Staples, Health Care and Utilities have rotated in ON A RELATIVE BASIS vs the S&P-500

MF Global After Effects

As of my last post last night about what it appears MF Global did (using client's funds to meet margin calls-STRICTLY ILLEGAL), it seems a new crisis is emerging as liquidity in several markets is drying up.

Specifically effected, in Australia Grain Futures and Options were suspended, Corn contracts were cut in half yesterday from Friday's volume.

 "Reports of short falls of client money ... if true would be a disaster for all the smaller brokers and banks as nobody will trust them anymore," one London trader said.


Think of this as being similar to a bank run, but not just on banks, more specifically on broker/dealers/clearing houses- a whole new angle to the liquidity freeze event.


I keep coming back to this Lehman comparison in many ways, but in this case, if and it looks like "if" has already started, customers start pulling their money from perfectly legitimate dealers, it will cause a self-fulfilling prophecy, like how the credit markets froze during the Lehman crisis.


We now have Lehman like events not only effecting commodities, stocks, but sovereign nations as well. A world wide credit/liquidity freeze would be something that I can't imagine could be undone.


Since Bernie lived through those terrible days of Lehman, I wonder if he'll try to get in front of this rather then play catch up like he did last time. It's already clear he's been flooding the market with money. This week may get even more bizarre and volatile yet.


Just as a reminder, I use to teach my beginner students to just stay away from market tops as the volatility was insane. Increased volatility is and has been for well over a century, the hall mark of every market top.

Main Resistance

I thought we might be coming up against a more localized resistance area, it seems the opposite is true.
 This is the daily 300 exponential moving average in white. Note that the area in 2008 in yellow is the exact area I used as a reference point as far as mass market emotion/psychology goes as the two areas share all the same major components, you may recall this post, I'll have to dig it up, but so far, the major components have played out almost exactly like 2008, it should be noted we saw about a 50% decline from there.

 Here's the same average today, it was broken to the upside just like 2008 and is now acting as resistance today.

 The simple 200 day moving average, which is a good proxy for determining primary trends by the slant of the average could be said to be slanting down at this point. Furthermore the same area is late August that was shut down by the 300 ema (see chart above) is also the same area providing resistance today (the price peak about the 3rd week of August at the red trendline).

 Here is an intraday chart carrying that very same trendline with a low volume bounce up to resistance and a increased volume decline after a failed test.

This is my proprietary Trend Channel, it is unlike Envelope channels, Bollinger Band or any other type of channel. It widens and narrows automatically as it adjusts to each equity's own recent volatility. It has proven to be very valuable in defining stop out areas for trending markets. A close below the lowest point of the lower channel (for a long) is a stop out, you can see we are very close to that point. I've used this channel with extraordinary success to hold on to major trending gains rather then making an arbitrary decision as to when and where to stop out. If you have Telechart or StockFinder, I'm happy to share it with you.

China Reiterates Position on EFSF/EU

Unfortunately I for some reason can't link to or pull up FT articles, so I have to go to other sources.

Today's latest from China comes in the form of an FT Op-Ed by the former member of the PBoC monetary committee (and just because he is a "former member", government officials don't speak out of turn in China).

Beijing will not ride to eurozone’s rescue


"Beijing has repeatedly expressed its wish to offer “a helping hand” to Europe. Eurozone countries, however, have to understand that they will have to save themselves. Expectations of a “red knight” riding to the rescue are sorely misplaced."


"As Wen Jiabao, premier, pointed out at the 2011 Dalian World Economic Forum, the European Union has first to put its house in order. When countries and political parties in the eurozone squabble among themselves over how to proceed, how can China support any hastily assembled rescue packages?"


"From the perspective of domestic politics, bailing out EU countries with Chinese money is hard for the Chinese people to accept. The tens of millions of elderly Chinese will demand to know why they should pay for rich Europeans to retire early when they do not have a decent pension system of their own. Unlike America, which has accumulated huge foreign debts, the eurozone as a whole has a healthy external position. This means that eurozone countries can solve their sovereign debt crisis with their own money, as long as Germany and some northern European countries are prepared to foot the bill. The Chinese people will ask: if Germans do not want to contribute more money, why should China bother?"


" there are indirect ways to help. Beijing should allow the renminbi to appreciate against the euro and give European companies greater access to Chinese markets – which, of course, needs to be reciprocated. An improved eurozone current account through trade as well as Chinese investment into Europe will free up funding within Europe and allow more savings to be directed towards governments."


"To be clear, China should not give the impression it is taking advantage of the misfortune of others. But, for Beijing, financial decisions should be based on financial considerations. Do not blame it if China’s help is short of your expectations. China has never claimed it can save you from the debt dragon – and, on its own, it will not."

ISM Also Misses

Yesterday it was Chicago PMI, today ISM which came in at 50.8 on expectations of 51.8. The worst component in the ISM was prices which fell from 56 to 41, further giving evidence that the 12 month forward looking EPS of stock's earnings is rolling over.

Being the "FAD" is meeting tomorrow I believe, discussion is certainly warranted, however fast moving events in Europe have made that difficult. I would like to just remind you of you know what... "The FAD knee jerk reaction". Members who have been here long enough have seen it time and time again, the original reaction is reversed within hours or a day or two. In fact if I remember correctly, the last reaction was initially bad and then gave birth to the start of this consolidation period after the market had fallen badly.

I'll try to fit in some discussion at some point on this week's FOMC meeting.

I Hope We Didn't Forget About the $USD

It's true, the negative divergence in the market was long and was very deep (which doesn't bode well for the future of the market). In looking at charts, confirmation is important and I brought the dollar up several times. I hope we didn't forget about it or fail to realize the importance of what we were seeing. Remember, the market and most commodities have an inverse correlation to the $USD, meaning a strong dollar means a weak market and thus the Global currency race to the bottom to protect each countries markets, just like Japan Sunday night.

 This is the bullish descending wedge in price I pointed out in the US Dollar Index (50% of the Index is weighted by the Euro as the single most important currency in the basket). There was also a leading positive 3C divergence, this essentially is a very big warning of very bad things to come (barring interventionist policies that are effective).


 The current formation is almost a twin of the 2009 formation which rallied 20%, but didn't have the same disastrous effect on the market due to ongoing POMO and other "FAD" intervention. With the current correlations in place, this is a grim warning.


 Intraday UUP 15 min has seen a very big positive leading divergence and wouldn't you know it, the last thing it did was break support and hit new lows in a head fake before launching up.

The 30 min chart is hugely leading positive.

This is more of a macro picture, but an ugly one.

USO early update

 USO's breakout above resistance and the fall back below-this is a daily chart and there is resistance now at the trendline which was support, now resistance.

 Here's the 5 min chart of the same trendline

 USO vs EURO again USO led the Euro by a bit, however the Euro has been the leading indication for USO the last several days and a pop above resistance makes some sense from a market maker's perspective.

The 1 min chart going negative yesterday, the opening positive divergence based on EUR/USD and a negative and slight leading negative divergence, all still on the 1 min chart.