Wednesday, May 13, 2015

Daily Wrap

The headlines today are more or less, "Equities and bonds continue swell-off",  however I was surprised at the lack of movement in the major averages today, I expected more near term downside, but not for the bear's sake, rather to solidify a base for a bounce we may be interested in trading. The problem right now is that the charts don't support a trade for a bounce higher that is reliable no matter how long or short its duration. 
The SPX (green) vs TLT (20+ year bond fund) today with weakness in Treasuries more so than equities, but this is what we expected (of both actually), equities seemed to hold up better as soon as Europe closed with a lateral trend.

The dip in Treasuries/TLT is something we expected and are seeing constructive positive divergence in to, Treasuries/TLT Update... these were close to showing solid enough charts to ad the second half of Bonds long for a counter trend bounce.

The long bond which outperformed even equities last year (as a sign of the carry trade unwind) has seen the worst start to the year since 2009! Thus we are primed for a counter trend bounce/short squeeze and this is one of my favorite near term trade ideas.

As I've said all day yesterday, "The market needs to pullback and allow some accumulation short term to give us a more reliable base in which we can enter some positions before moving to the short side and selling /shorting in to price strength.

Either way, I think we were wise to stay clear of new positions yesterday as the daily close was essentially flat (SPX -0.03%, Dow -0.04%, NDX +0.13%, Russell 2000 -0.07%. Transports -1.04%). For all intents and purposes, the market was a meat grinder and pure open risk today with no moves worth trading whatsoever. Remember there are always 3 positions, long, short and on the sidelines.

 This range in the daily SPX is an absolute meat grinder. I would NOT trade this unless you have an edge...which I believe we have, still there are days that simply aren't worth it as you see in the closing percentages of the major averages.

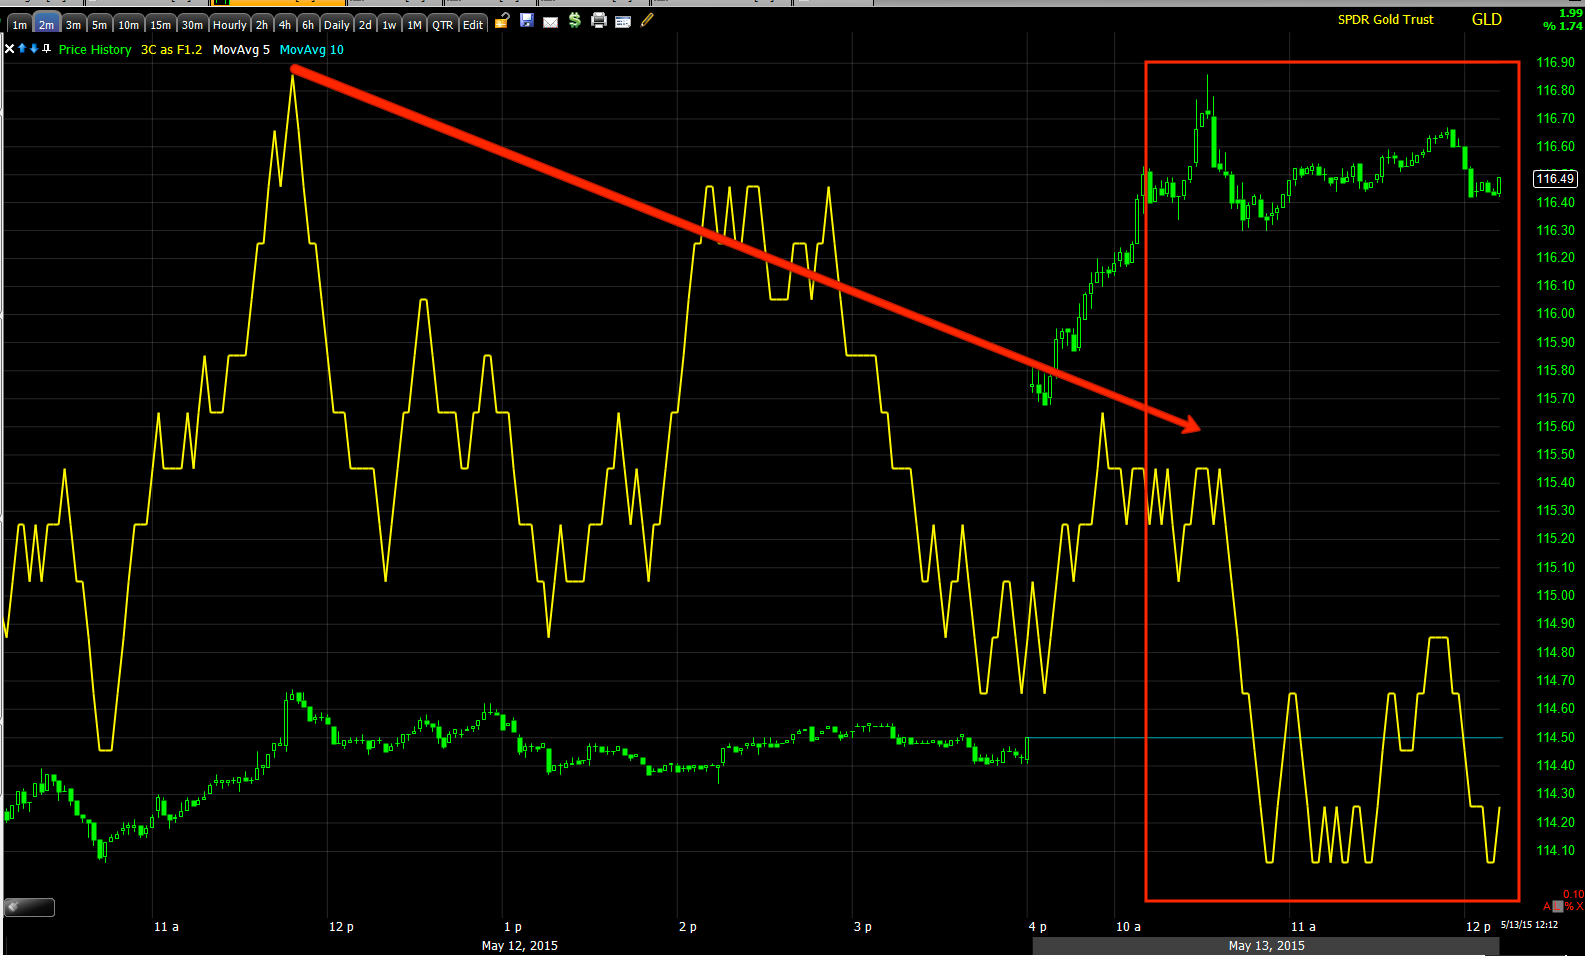
We didn't take on any new short term trading positions yesterday, but I was close to opening a partial long position in Gold/GLD yesterday, but decided to wait for the trade set-up, GLD / Gold Long Trade Set-Up. In all honesty, I believe the move today in GLD would have been due to dumb luck, not the charts.

KNOWING WHAT I KNOW TODAY, I FEEL JUSTIFIED IN NOT HAVING TAKEN UP ANY NEW POSITIONS YESTERDAY, the objective evidence simply wasn't there to support it.

I'm looking for some kind of improvement in short term charts with the bounce being represented by (in this example), the 10 min QQQ low. It has been my opinion since yesterday that we need to see some downside to allow short term accumulation to form a wider "W" base bottom that is capable of supporting a bounce without suddenly falling apart, otherwise I'm content to stay out of the way. Above I have some arrows representing the pullback to the trendily to form a "W" base, the bounce in white and what comes next to the far right in red.

 QQQ 10 min positive divergence along the lines of a bounce, but nothing that will change the market, useful however in selling in to strength like NFLX which we recently opened some short positions and put positions that started gaining today.

 On the day most major averages were pretty close to each other with transports being the big laggard, this is and has been one of our favorite core short positions with at least 2 entries.

On the week we saw the initial early week weakness from Friday's "Week Ahead" forecast, and now we are flat. I don't really care whether we pullback or not for a bounce trade, as long as the charts improve, but in my experience, usually they need to pullback for that to happen.

As you can see, transports have been the laggard all week.

Again today macro data came in weak (export/import and Retail Sales) which had a dramatic effect on the $USD...
 The $USD crashed (now -1.1% on the week) at the release of retail sales at 8:30 a.m., but note the positive divergence in the $USDX futures today.

If you look at the 60 min downtrend in the $USD and the counter trend bounces off their bases (yellow trendiness), it looks like the $USD needs a slightly larger base before its ready for the counter trend bounce I expect which should be larger than the previous bounces.

As for the Gold reaction to the $USD drop, it popped at 8:30 a.m. (same time) and the 3C charts of gold futures show negative divergence/3C distribution all day-
'
 1 min

3 min leading negative to the far right...

5 min gold futures leading negative, so I feel the Trade Idea: GLD FADE- HIGHLY SPECULATIVE fade trade was the right choice.

As for currencies...
 The EUR/USD is showing a negative divergence as the $USD carves out a base/positive divergence from today's fall.  The negative 1 min divergence in the pair makes sense, although I suspect a little more reversal process time in the $USDX is needed.

The Euro futures also show a negative divergence. With the Euro losing ground, the $USD will gain ground.

Meantime...
 The USD/JPY saw a big move lower which is now working on a positive divergence which I think will be needed to support any bounce over the coming days.

The Yen futures had their strongest day in 2 months as i seems pretty clear the carry trade unwind continues.

As for our USO position (puts and equity short), Monday I said I expected a bounce of a day or so, I count yesterday as a day and today as "or So".

 USO daily chart and the move above base resistance than has always been expected to fail with churning at the first two yellow arrows on increased volume and a "Dark Cloud Cover" bearish reversal candle today on volume,

The 15 min $USO 3C chart is leading negative right at the break above base resistance which also tells me the move was never meant to hold, but to create a bull trap and downside momentum as bulls are stuck in a losing trade, creating a self-fulfilling event or snow ball event to the downside.

As for leading indicators, they are either pointing to downside in the near term as expected or they are simply deteriorating in terms of the big picture as expected or perhaps both.

As we saw last night, Pro sentiment has taken a hit, today it's even worse...
 Pro sentiment was leading the SPX lower yesterday, much more so today

*SPX prices (green) inverted* Interestingly as we saw this at the end of the day, VXX showed poor relative performance, how much more so today which makes me happy we did not put out any VXX long trades on expectations of near term market downside.

 The same was evident in Spot VIX today as well.

 High Yield Corp. Credit v. SPX deteriorated even more, this is usually the first lever they turn to for short term market support, but it looks like the pros are getting out of risk assets as fast as possible.

 This is the 3C chart for HYG 60 min leading negative with huge distribution. It may be worth repeating that Wall Street maxim, "Credit leads, stocks follow".

In that case, take a look at the bigger picture.
HYG in red vs the SPX in green. Note the confirmation through 2013/2014 and then the series of lower highs and lower lows in HYG which is now significantly dislocated with the SPX, this chart more than most is pointing to a very dramatic downside event in the market big picture.

As for internals, yesterday they were luke warm which may be why we had such a luke warm day today.

Yesterday's Dominant Price/Volume Relationship for the major averages was only in about half and it was the least influential. Today we have the Dow and NDX both dominant and the Russell and SPX very close to dominant with the most bearish of the 4 relationships, Close Up/Volume Down (remember this is a count of the component stocks, not the average itself). This would suggest a next day move lower which would fit with the scenario I have been looking for since yesterday.

The S&P sectors were more lukewarm with 4 of 9 closing green led by Tech with Utilities lagging. Of the 238 Morningstar groups, another middle of the road reading at 134 green of 238.

I see no reason to change our short term forecast and I see no reason to enter new trades without strong 3C chart confirmation, TLT is close, GLD I believe is looking decent and Oil is looking good as well as NFLX for the moment. If new trade opportunities present themselves tomorrow, I'll put them out, but like I said above, I'm glad we didn't yesterday, although that wasn't by choice or luck, that was because there were no charts backing a strong trade.

It's a bit early for Futures, but I'll check them a bit later and report of there's anything standing out other than the $USD seemingly getting its act back together. I have a feeling today's downside move wasn't just about retail sales, but about stop runs, etc. before an upside counter trend bounce.


Have a great night!

Market Update

It has been an exceptionally dull day most of the day, even the NYSE TICK has been "Blah", however several trades are moving our way including TLT setting up, USO breaking down, GLD looking ready to break lower and the charts for the averages have finally started to move.

I always warn about quiet markets or dull markets, "They're like the kids in the room next door being a little too quiet", you know they are up to something and it's easy to let your guard down.

In any case, there are some potential trades that could be taken like VXX long or IWM short, but these are the moves that are meant to set up the second trend/trade of last week's forecast for this week and they will eventually lead to setting up the third and largest trade. Personally, I don't feel comfortable trying to scalp this close to the scalp and would rather wait for the intended trade set ups to fall in to place. There's that pesky patience thing again...

There are quite a few charts below for multiple trend analysis and multiple asset confirmation, some may give you enough of a view to make a decision as to whether you want to engage in scalping trades here.
 This is how the averages have looked intraday most of today, nearly perfectly in line as is this SPY 1 mn chart.

There's not much of an edge with the chart like that other than position management. However, these have recently turned in the direction we have expected.

SPY three minute leaving negative  and strongly suggesting the near-term downside move that we have been waiting on to decide whether to enter positions for the next anticipated leg (up), which I suspect we will.

 VXX trades opposite the averages so this two minute positive divergence also suggests the averages are going to move lower. However, this is not quite enough of a divergence for me to be willing to risk money on a trade.

 Three minute VXX chart shows the same with a little more strength. Again, this is the difference between probabilities which are that VXX moves up very near term and high probability, low risk trade setups.


 This is the inverse of the VXX, XIV and it trades with the market. Note the intraday deep leading negative divergence after being in line most of the day. This is confirmation of the VXX charts above.

 VXX 5 min doesn't show any divergence, this is why I do not consider this a high probability trade.

The problem with probabilities is that VXX could move up and I expect it will, but without strong confirmation on charts like this, it could also fall almost instantly wiping out all gains and leaving you at a loss.

 XIV 2 min again confirms the VXX and market averages suggesting that near-term pullback we have been looking for.

XIV 5 min is getting a little more serious, If VXX we're also positive on its five minute chart I would consider a short term long trade.

 QQQ 1 mn has seen some deepening leading negative divergences intraday.

As has the two minute chart.

The IWM is showing a more spectacular leading negative divergence intraday suggesting the lower prices we have been expecting near-term.

IWM 2 min

IWM 3 min

Just because I took a quick look I thought I might add this as well as most stocks and industry groups will move with the market. XLF/ financials.
 1 min leaving negative

 3 mn deeply leading negative

5 min again suggesting with multiple assets confirmation, we she market downside in the very near term as expected.

This downside I am looking for is to build a stronger base for a bounce which is where I would want to take positions. This 10 minute QQQ chart is indicative of the expected bounce so long as it continues to hold up.
QQQ 10 mn.

After that, As the "Week Ahead" forecast suggested, we'd be using any bounce price strength to enter additional short positions.
This 15 minute VXX chart is indicative of the major market downside I am expecting after our bounce.

XIV, the inverse of VXX on the same 15 minute chart shows perfect confirmation. You can almost consider XIV as the SPY/market itself.

Treasuries/TLT Update...

It looks like the TLT/long Treasury counter-trend rally trade set up is coming our way as it does what we were expecting and what it really needed to do to hold a counter trend rally which is by nature within a bear trend, but these are some of the strongest rallies you'll ever see, even if they fail at the end as they almost always do.

As a Quick reminder, here's the initial Trade Idea: Long Bonds / TLT  from last week. We only took on a half size position because I suspected we would see a pullback and a wider base form where we could add the second half of the position, since then TLT/Treasuries have pulled back.

As noted last night, since Payrolls, the long bond has performed the worst and Treasuries are near their extreme end with regard to shorts which are very thick. Ironically the initial trade idea came because of a short trap set-up and grew from there, the head fake or Channel Buster concept.

There are a few concepts on this daily chart of TLT (20+ year Treasury). The first warning sign was the peeling away from the long term moving average or trendily, this is part of mark-up in which we see distribution, it's the period called "Excess" and although it looks bullish with the increased upside ROC, it is a warning sign that the trend is about to change.

We had 3C signals confirming the long term trend through almost all of 2014 until the end of the year when I noticed and posted that something significant had changed.

The break below the trendily is similar to why we don't short the initial break below the neckline of a H&S top, it's full of new technical shorts and Wall St. knows it and will use the opportunity to run them out of the trade with a strong counter trend move back above the trendily, that was the basis of the initial trade idea with more evidence gathered along the way. So I expect TLT to rally above the trendily on a counter trend move and eventually fail to a new lower low which I'll want to trade as well, just on the short side at that point.

Near term the base in TLT was too "V" shaped and not strong enough to hold a counter trend rally, thus the half size position last week and suspicion we'd see a move back down to form a wider "W" base that can hold the move, that's where we are now.

A closer look at the area on a 60 min chart with our partial position (white) and the expected pullback to at least the yellow trendily, but more is okay as long as we see accumulation on the pullback which will give us an idea as to when to enter.

Looking at Treasury futures just 10 minutes ago across the entire yield curve and through 5 different timeframes, I believe near term we still have some downside to go, but so far it has been a constructive pullback creating a larger base and a deeper bear trap.

 The 1 min TLT chart shows where the partial (50%) position was entered in white on the 7th as I suspected a pullback to form a larger base, the next day on the gap up which I decided not to take the gains, but rather look at this as a longer term position, we had a clear negative divergence signal suggesting the pullback I suspected.

Since we have made something similar to a "W" bottom to the right with accumulation at the lows of the range, this is exactly the kind of confirmation we want to see in this situation.

 A closer look at the same chart shows the intraday lows today have not broken below Monday's, I suspect that's why we still have futures calling for a little more downside. This will trip up stops as well as bring in new shorts and give TLT the fuel it needs for a strong counter trend rally.

Watch volume for signs of stops hit/ new shorts entering as we move below Monday's intraday lows.

 The 2 min chart is seeing migration or strengthening of the positive divergence locally . Also note the change in price trend from down to more lateral as the positive divergences start showing. If you look at the range closely and examine the divergences, they are definitely trying to accumulate at the low end of the range and send prices lower as they start to rise by letting out some supply (second red arrow to the right).


The 5 min chart shows the much larger accumulation area with the 3C minimum target at the white box on the price axis around the $123.50 area, but that's minimum target, the entire point of a counter trend rally is to get traders to question the downtrend and to do that, they need to be spectacular.

We should have an entry soon for TLT /Treasuries long.

GLD Follow UP

Interestingly it was just yesterday that the Gold trade set up was posted, GLD / Gold Long Trade Set-Up , which is one of the reasons it was difficult to determine whether are not a fade of this morning's parabolic move was justified or not.

It has not been a matter of whether or not the gold charts look strong enough for a nice Long trade, it was and I believe still is, a question of timing and a high probability, low risk entry. I will leave the trade set up that is linked above as it is for now and just concentrate on this morning's move and resulting trade idea.

 The GLD 5 min chart is part of what what was so challenging in determining whether or not to fade this mornings move. This is how the GLD five minute chart looked yesterday with a leading positive divergence.

 This is how the exact same five minute chart looks today with this morning's parabolic move higher. Under normal circumstances this looks like confirmation of the move. However this leading divergence which is one of the reasons I like the GLD long trade and posted the set up yesterday, is really not a reaction to today's price action, it was already in place yesterday.

 The three minute chart is also one of the charts that played a role in the trade set up from yesterday. It has not confirmed the upside move this morning which is part of the reason I decided to go with a fade trade.

 The two minute GLD chart should have been able to easily confirm price action within the first 15 minutes of the market open, rather it is still negative in line with the trade set up from yesterday.

Remember, yesterday's post was not an actual trade but the set up we are looking for to enter the trade.

 Gold futures intraday also have not confirmed on this one minute 3C chart.

And the five minute chart is in line with yesterday's trade set up which is Gold already has strength, we are simply looking for a near-term pullback to enter at a better price point in lower risk with a better timing.