Tuesday, March 6, 2012

Price -Volume Relations, Further Confirmation

Earlier I said I'd expect a dominant Price/Volume relationship in the market today.

Here it is, dominant and across all the major averages.

 NASDAQ 100 components

 Russell 2K Components

 SPX Components

Dow 30 Components.

All are dominant, all are the same, Close Down and Volume Up. In the context of where price is, this relationship is considered short term oversold and again, points to a probable bounce tomorrow.

Financials Update

After skimming through some 3C charts of what I call the 3 pillars (of the 10 major market sectors), Financials, Energy, and Technology (I don't consider any rally viable without the support of all 3 groups whereas the market can rally without something like Discretionary), it is becoming my opinion that any market bounce would be led by Energy and Tech which would make some sense if there's a Euro rumor floated as the $USD would drop in value and Energy prices would move up to compensate and Tech obviously because of APL's event.

This (weaker bounce) may set up some nice short trades in financials, many of which were hammered today.

Here's a look at Financials/XLF

 First, today XLF saw the biggest 1 day drop since the rally started at -2.43% (remember, on the way up, the average percent gains were .20-.45%-very small, just very consistent). Today's move in XLF took out about a month of longs.

 XLF daily, you can see the accumulation in Financials as I mentioned back in August/September and going in to the October lows. Since, we have  negative divergence on a daily chart which is a very strong signal.

 Here's the hourly negative divergence, note how it worsens at the top when financials start rounding over.

 Here's a 30 minute leading negative divergence, again it was worse at the recent rounding top.


We can see on a 5 min chart the divergence as well in to that rounding area, there is a slight positive divergence, which I would expect to see considering my broad market expectations, but Energy and Tech seem to have an edge o financials. Perhaps we see a gap fill and that could set up some individual names, I highly doubt Financials can make a false breakout new high.

Just for comparison, take a look at a few of the inverse ETF for financials, FAZ, this is a 3x leveraged short on financials.

 Note how the long term charts are directly the mirror opposite of XLF, this again is the kind of confirmation I like, they are showing positive divergences.


Below is the 2 min chart, FAZ jumped +6.55% today, yet we see a small negative divergence, suggesting a pullback tomorrow, this fits well with the market theory I have and the other charts we have seen.


ES Update

This is purely gut feel, but I would think a gap up tomorrow would be the most logical move and perhaps some additional momentum as the I-pad 3 is launched, however, there are rumors that Apple TV will be launched as well, this is a bit of a wild card, if it were launched that would give AAPL more upside momentum, on the other hand my research indicates AAPL has had trouble with content providers and therefore Apple TV may not be ready for launch. If the whisper rumor on the street is for Apple TV to be launched tomorrow and it is not, that could have a detrimental effect on the AAPL launch overall. This is an outside chance, but it could be a 1 day head fake in a situation like that, I'd prefer to see a strong close and retail wildly bullish.

In any case, tomorrow I don't see any major economic events that would really light a fire under the market, we have MBA Purchase Applications at 7 a.m. EDT, The Challenger Job-Cut Report at 7:30 (slight potential catalyst there), The ADP Employment Report at 8:15 (retail will react to this one, but for your own knowledge, this is a noisy series and not very accurate), and finally Productivity and Costs at 8:30-that's it for pre-market. So if there's to be a gap up on the open, I think it would most likely come from ES (S&P E-mini Futures) overnight. Perhaps at 3 a.m. EDT when Europe opens some news story about the Greek PSI is flipped and the market grabs on to that (in that case t would almost certainly be refuted within a few hours, but they just need something to get ES rolling).

Here's what ES looks like for today and thus far tonight.

ES from left to right, pre-market we saw a 3C negative divergence at 7 a.m. sending ES lower in to the N.Y. open.

We had a couple of positive divergences, but the most they did was create lateral trade or a break in the downtrend briefly and they failed sending ES to the lows around 2:15. We saw a modest bounce in to the close and since then, 3C is not in a positive divergence, but ES has moved higher then the NY close at 4 p.m. (1342.25 vs 1345 right now).


VIX / VXX Update

The VIX is also called the Fear Index, if you were trading in during 2000, then you are probably pretty familiar with it as it use to be pretty good at predicting reversals when above 40 or below 25. The VIX has an inverse relationship with the market as you'll see on the first chart. Low readings indicate complacency and are often associate with market tops, high readings indicate fear and are often found at market bottoms (see how emotions are a great inverse indicator?). I should mention that the VIX was re-worked in 2003 and the old VIX is now called the VXN. The VXX is an intraday volatility index like the VIX and I use it for timing for the VIX.


 The VIX is green, the S&P-500 white, you can see the inverse relationship clearly on this daily chart.

 So the VIX has been hovering around the lows recently indicating complacency in the market, traders have little fear of a market correction of fall. We can use 3C on the VIX to show accumulation and that's what we see here.

 The last time we had VIX accumulation 9not as strong as you can see) was going in to May, June of 2011, July we saw the market water fall sell-off so 3C has some value with the VIX.

 This 3C positive divergence in the VIX was around May 2008, which was also the top of a bear market rally and the SPX dropped about -52% from May 19th 2008 to March 9th 2009. Our current divergence is about the same size as the 2008 divergence, actually right now it' about a month longer (typically the longer a divergence persists, the bigger the move that springs from it).

 For timing, the VXX intraday charts are useful. Here we see the 60 min chart, the longest intraday timeframe and the most important, there's a solid positive divergence, indicating it is likely the VXX/VIX will head higher shortly, which would have the opposite effect on the market.

 The 30 min chart is sharper, it has more detail and shows the second bottom of this small double bottom or if you want to call it the test of support, has a very strong 3C leading positive divergence, indicating that it looks like the VXX ix under accumulation for a move higher, again it would have the opposite effect on the market.

 The recent 5 min chart shows accumulation sending the VXX higher on the 24th, the market was down about 1/2 a point on that day, then another positive divergence which is bigger and stronger as it is leading since March 1st culminating with a move in the VXX today of 6.68% and the SPX fell 1.46% which by the way is the biggest move down since the rally started.

Here you can see today was the largest % drop since December.

The VXX 2 min chart showed a negative divergence today around the same time the market, especially the IWM was showing an increased positive divergence ( I love confirmation like that).

So the take away... It's back to the AAPL Theory I laid out Friday and more recently Sunday in this post.

The short term indications would suggest we get a move up, the longer term indictions suggest that move will fail and will be the trigger to bring the market down.

You can also trade the VIX options or the VXX, several members trade the VIX and have seen some amazing % moves.


GLD Update

I'm not happy with myself right now. Last week I put out a head fake trade in GLD that netted nearly 215%, after that, I said what I was looking for to enter the next trade, it came and I totally missed it, but there may still be a happy ending.

I'm not going to get in to the longer term GLD analysis in this post, just the shorter term trades, which obviously have made some good money.

 Lets start with last week's trade. At the white arrow we were at resistance, GLD was showing negative 3C divergences and on that day I said, GLD is going to have to breakout to sucker in the longs as resistance was in place. The very next day we got the breakout, 3C still looked negative so as I suspected, it was looking more and more like the head fake trade I envisioned the day before. Some where around the red arrow I bought GLD puts in the WOWS options model portfolio and a few days later we had that big decline confirming the head fake and I closed the trade for a nearly 215%gain. I then said I'd be looking for the next short trade and I expected 3 days of consolidation inside the long down candle (specifically a falling 3 methods pattern, but I didn't care if it was textbook or not, it was the 3 days). As you can see, we got the 3 days and another decline today, bottom line, yesterday I missed the 3rd day and entry. That's on me.

 Here we see the negative divergence that sent GLD lower and gave us the 215% move, however since yesterday and in to today, it appears we have a positive divergence suggesting a move up on a short term basis.

On a 5 min chart, the divergence is leading positive, so this looks like GLD is going to see a pop. If it doesn't gap up tomorrow on the open, there may be a quick long trade there.

If it does gap up on the open, we'll take a look and see if it makes any sense. Other then that, we'll just be looking for the next entry, long or short, it doesn't really matter as long as it's a high probability/low risk trade.

Since GLD has been trading with the market to some extent lately, this may be taken as another sign that we see a move up tomorrow, right in time for the I-pad 3 release.

As a reminder, Thursday at 3 p.m. we have the results from the Greek PSI debt deal, which doesn't look good so far (unless they do what they already said they wouldn't and extend the deadline). The implications of the debt deal are dire for Greece, if the bond /PSI deal fails, Germany has been pretty clear that the Greek bailout is off the table and then we are looking at what? Perhaps the first EU default?

TLT Hinting

Last Tuesday in the "Daily Wrap" I posted this chart of TLT
Below the chart I said,

"Here on the 15 min chart you can see accumulation sending TLT higher and a negative divergence that fits with the candlestick reversal above, so I'm looking for a pullback in treasuries"


I was just thinking about my meeting last night with the hedge fund manager and how they loved my AAPL analysis and was wondering if they put the trade on or not. Then I thought about how much time I spent showing him TLT and how interested he was in TLT, then I thought, "I haven't even looked at TLT today".


So before I even pulled up the chart, I knew TLT would be up as the market was down today, that was a given, but I thought to myself, "I bet that TLT didn't show any accumulation today and wasn't even in line".


Sure enough, I jumped to TLT and take a look at what I found...
No confirmation and a negative divergence just as I suspected.


Now look at the longer term TLT chart (15 min)...
We see last week's negative divergence sending TLT lower and a positive divergence at the lows.


So where am I going with this? Just go back and look at my expectations for the market via AAPL as published Sunday night...


So lets assume I'm right about AAPL, where would TLT be in that scenario? It would be at or below the lows of 3/1 where they appear to be accumulating it, why accumulate TLT several points higher when you know what's going to happen will send TLT to better prices to be accumulated there?


Th next question and this is where we spent a lot of time last night, the long term TLT chart. If I'm right, the AAPL move is going to look very strong and not very many people are going to be confident in a bearish market view, but that's the purpose of a head fake. The only reason to buy Treasuries is out of pure protection, the yields are virtually non-exisitient, but if you need a safe haven to park capital (especially mutual funds that can't go short or managed funds), it's going to be treasuries, which is precisely why we spent so much time looking and talking about the following chart...


TLT 60 min-In late July TLT was accumulated, also in late July the market saw a water fall sell off of 16-18%. We saw accumulation through August and September and fully expected a new low and a strong rally off that low (which was October 4th), so while the market was being accumulated for the October run, TLT was being distributed. The red line is about where the TLT top should have just broken down completely, but right around that time we see a positive divergence start around December, which correlates with what? The market rally. Based on 3C and a bunch of other indications, I have maintained throughout my belief that we are seeing a bear market rally (and I know there are technical rules that could be used to argue against it), but the job of a bear market rally (rules be darned) is to sucker in longs, appeal to that sense of Greed that they missed the rally (thus we saw the Cats and Dogs rally, a common occurrence before a market decline as traders who missed the bulk of the rally come bargain hunting looking for cheap stocks that haven't already popped). This rally did it's job, you saw the dumb money sentiment chart this week, it's at extremes and when that happens, the market is usually at a top.  So the positive divergence in TLT over the same period as the rally's negative divergence tells us something about the macro picture. The short term charts above tell us something about the timing.


Finally, TLT is the flight to safety trade, there's not much reason to be in the trade in a risk on rally.


Here's the SPX in green and TLT in white, notice the inverse relationship, why would you want to be in TLT if there are better returns in equities? Thus the inverse relationship, but look at TLT since August, it has been trending higher with the market, not the typical inverse relationship suggesting TLT has been under accumulation as the 60 min 3C chart above suggests. The only time when TLT has dipped significantly enough to be noticed away from the SPX uptrend is recently, and why would that be? If you are expecting an imminent drop in the market over the next week or so, you want to buy TLT at the best possible prices before the crowd comes rushing in.


You can't deny the late 2011/2012 trend in TLT most certainly is not the normal inverse relationship we normally see. I didn't think to put this chart together until I noticed, "Hey, TLT really hasn't declined that much during this rally" and if this was anything other then a bear market rally or TRAP, there would be no reason in the world to be in Treasuries, first there's better returns in stocks and second the yields are next to nothing.


Just something to think about...


More on collecting loose change in front of a steam roller... EU Edition

Europe had it's worst day since its rally began, today's Bloomberg 500 EU index lost -2.8% today which is the worst day since the rally started in November. As I have been saying, "this market is dangerous to be long" especially any stock or ETF with a high market correlation. As proof, the move today in Europe wiped out 5 weeks of gains, similar to my earlier post on the American averages. Even if we bounce from here (and I think we can) the damage is done, those who got stopped out may thank their lucky stars they got stopped out on a -2.8% move rather then something much nastier in the days and weeks ahead.

What is even more telling, credit is performing worse then stocks and this has been a trend that's been going on for well over a month, it is especially apparent in bank that accepted LTRO money vs, those that didn't. Financial credit in the EU has been selling off hard and the same has been happening in the US, actually nearly all corporate credit (check today's earlier 'Risk Assets/Credit" update and look at High Yield Corporate credit which is falling off a cliff).

It's not only Credit and Stocks in both the US and EU (as a side note, this bearish flush-out is probably likely to produce a bounce, as I stated a week ago or so, they'll want to keep the "Buy the Dip" crowd as long as possible), but sovereign bond yields are rising, particularly in Italy and Spain, moving toward 1 month highs.  Where's Sarkozy and Draghi's LTRO carry trade now? That is a question we can answer, it's a negative carry of 25 basis points all locked up in the ECB's deposit facility.

You may remember when the ECB completed their bond swap with Greece before Greece introduced retroactive collective action clauses, I said what the ECB did was save itself from taking a little loss, but they created a senior and subordinated bond market (senior if you are the ECB, subordinated if you are anyone else) and more PIIGS will either need or want the same debt haircut that Greece was offered (whether they can get it or not is up in the air until Thursday, my guess is no). Effectively, what this creates is a situation in which to get to the targeted debt to GDP, the size of the private bond holder haircut will depend on how much of that particular sovereign's bonds the ECB holds. The more the ECB holds, the bigger the hair cut for the private sector. So who in their right mind (including recipients of LTRO cash) is going to go out and buy sovereign debt when the precedent has been set and they know they are virtually guaranteed to lose money as each of the PIIGS follow in Greece's footsteps? I said this would come back and bite the ECB in the rear end and why? Because already yields are rising and the only incremental buyer left is the ECB, so they saved a little on Greece and they'll have to spend a lot on Italy, Portugal, Spain and Ireland (Ireland is a special case if they go through with the referendum).

Are these people evil geniuses or are they as dumb as their actions suggest?

After being ordered to recapitalize and after selling everything that wasn't nailed down and still being short tier 1 capital, who really expected the banks to take the LTRO money and buy sovereign debt when that is the thing they are trying to off load in the worst possible way?

Another AAPL Update

AAPL is essentially the market, that is why I'm looking for the signal in AAPL for the broader market. Recently and since the last update, I see some improving 3C 1 min, so I'm guessing that we may very well get the AAPL move I've been talking about since last Friday.

AAPL 1 min is starting to lead a bit more.

Remember on Friday and Sunday I wrote that AAPL was likely going to see a head fake, the problem was I didn't expect the move to start until Wed, but the Bollinger Bands were suggesting a move on Monday. We did get a small head fake a big drop in AAPL. Yesterday I said, it may very well be that they are using that shakeout to accumulate from the weak hands that got shaken out and that will be the drive behind a true head fake move that can close above resistance. What I'm seeing here now fits with that line of thought from yesterday.

SJM Update

 I've put out as many reminder as I can on trade ideas like SJM, we were looking for a break of that trendline and there it is, this is why alerts are essential so I hope some of you caught it.

 Short term on the 2 min I see a positive divergence, just like USO when it broke the channel, it returned to kiss it goodbye, and that is likely what will happen with SJM so I'm closing the model portfolio trade here and looking to reposition, maybe on a straight short. If I miss it, well there's a bus every hour.
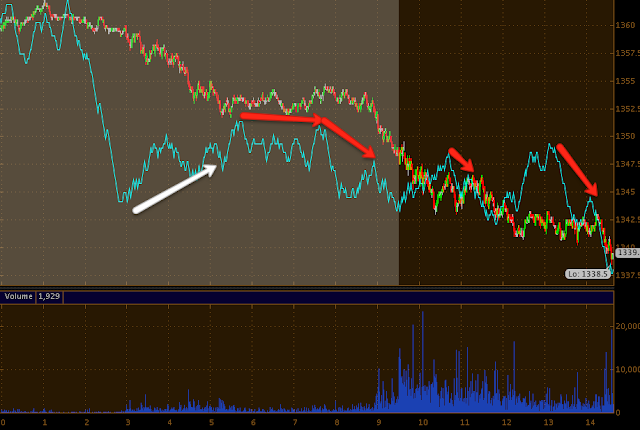

 Longer term, the flag looks like it is really in trouble here, but again, even a headless snake can lunge toward you. I'll be looking for another entry on a bounce toward the lower flag trendline.

Here's the put position I'm closing in the options model portfolio.


Market Update

This isn't an easy update, you'll see why and I think it's because the character of the market is changing, it's these changes in character (even small) that give us the biggest hints.

First the market has been diligent about not holding early losses like today, not this long and almost never on a close. Second the market has been diligent about filling gaps, if either of these change, we have a definitive change in character, but as you know, I've been expecting that this week.

Here's te update and why it's difficult.
 You can see the 1 min DIA negative divergence from late yesterday, the 1 min chart has been choppy and I suspect there's been some small accumulation in there, but this doesn't look at all like the kind of 1 min positive divergences we always see. For me, this is a change in character and my first inclination is to say that there won't be a strong end of day move as has been the norm, but perhaps this is being gathered for a gap fill tomorrow and as you know we have the I-pad launch 3 tomorrow and you probably remember my thoughts from the earlier AAPL update (it is still within range to put in a stronger head fake move then what we saw yesterday).

 On the 2 min chart it seems like we are seeing the culmination of all the smaller 1 min positive divergences, I would guess this may be for a gap up tomorrow.

 We see the negative divergence yesterday and a 5 min positive divergence today, again, because of the lack of a strong 1 min, I feel it is more likely to be a gap then a late day recovery attempt, but as you saw, Credit and risk assets are all selling off hard. With divergences only out to 5 minutes, some bad EU news could probably overwhelm them, but I'm not expecting that until Thursday, although we have already heard leaks that the PSI can't garner even 70%.

 The DIA 15 min chart over the last week or so looks as it should, 3C is in line with the move down, no positives here at all.

Usually when the normal charts we look at are ambiguous, ES gives a decent signal, not today...

 Here's ES pre market with a few decent signals and during market hours, I don't see a positive divergence here at all. These are much bigger contracts so it may be the risk off mode is effecting ES more then equities. You don't want to get caught on the wrong side of an ES trade.

 The IWM IS showing a 1 min positive divergence like I would expect to see, this bothers me that I'm not seeing the same in all of the averages.

 The 2 min here has some positive divergence but they are not as strong as the DIA's.

 Skip to the 5 min and we do have a decent looking positive. This again tells me this is more set for a gap up move and maybe the AAPL breakout I'm looking for rather then end of day upside momentum, we'll find out very soon. In any case, a 5min of this size could be good for a move of a day or two, so that may reflect on the AAPL move I'm looking for or hoping for as a signal (head fake move).


 Boy am I glad I closed that QQQ put when I did this morning. I got out right at the top for a nice gain for an hour. However, again, no clear 1 min trend which if I saw, I'd be inclined to say we see end of day upside momentum.

There's no 2 min divergence at all.
 On the 5 min chart there is a slight positive, gap fill? That's what I'm thinking which could set up the AAPL head fake move.

 The SPY 1 min has seen some more positive divergent action later in the day.

 The 2 min is leading, but not VERY strong.

 And confirming the end of day divergence on the 1 min chart, we see it here on the 5 min. There is a chance this could build even longer, like in to tomorrow, I don't think it is high probability, but it's possible. The AAPL event would argue against this in my opinion.

 As for AAPL, there's a late afternoon positive divergence here. There also was a smaller one around the open.


 AAPL 2 min and yesterday's very small head fake move outside the triangle which was clearly negative sending AAPL lower for a nice quick trade. However the 2 min here is simply in line with price, possibly slightly leading.

 The 15 min is where the real weakness in AAPL appears to be, other then the 30/60, but 1 bridge at a time.

NYSE TICK today has been very negative, w haven't sen this in months, lots of sub -1000/-1500 moves and very few greater then 750.

I think at the close, the price volume relationships will be dominant and I would expect that they would be short term oversold, so that again argues for a bounce in to the gap and if we get that, then there's no reason we can't get the AAPL move.

For longer tem members, you know what these charts normally look like and I'm sure you can see the difference too. I look at this as a change in character and not for the better, much worse, but a I said, even a headless snake can move around quite a bit.