Wednesday, January 14, 2015

Daily Wrap

What an exciting day, there are so many records, firsts, etc. I could go on all night, but you can find that anywhere.

I'll say that our expectations which were (short term) built on yesterday's internals (Dominant P/V relationship, sectors, etc), left us with this conclusion from last night's Daily Wrap,

"What I like about these internals is that they are not extreme, they do point at a bounce, but not an extreme one which would fit with the 5 min charts falling apart in to some higher prices."

What this means is that a bounce made sense for today or the start of one, but it was not on the very strong oversold conditions that existed on January 5th/6th, which made any bounce based on internals , in line with 3C charts and other expectations.

It's hard not to say the market is not oversold with the Dow-30 down -658 POINTS from yesterday's highs to today's lows, 345 point range today and nearly -700 points in 27 hours.
However, according to internals, which is how I judge overbought/oversold (not price, not Stochastics) we had a weak oversold condition in line with a weak bounce or at least a bounce not well supported (it can still look very impressive, but not have the strength to hold out long).

Year to date performance has all of the averages in the red with transports leading them lower.
So much the for cheap gas=higher Transports narrative.

30 year yields hit new record low yields today as well.
Monthly chart of 30-year yields at new record lows today.

Retail Sales this morning was one of the biggest misses or "Negative Surprises" in about 5 years. The entire myth that lower gas prices would equal more consumer discretionary spending was just blown out of the water, but the charts held up and the market followed them rather than the macro economic data.

Gold was about flat at -.20 (GLD), silver (SLV) down -1.04% and Dr. Copper, down -3.21% (JJC) and about 15% over the last month,  this is Global Growth expectations and why Dr. Copper is followed by many as a leading indicator for the stock market.

Copper (JJC) in blue vs SPX (green).

However, as we have expected, Oil/USO bounced just as the 3C charts have been forecasting and in to oil's op-ex on NO CATALYST whatsoever, this was and is a market set up cycle which we could tell just by the EIA bearish inventories with a much higher build than expected, but other than a quick knee jerk, oil did not fall and in fact bounced to end the day (USO) up +3.69%.  Take a look at the moment oil popped higher this afternoon and the market averages, they were in tow so smart money has a lot in the pot that's just becoming apparent , even though the divergences told us before hand, putting it altogether and understanding the "Why?" is usually only clear after your chance to make money has passed.

Remember that there's no evidence whatsoever that this move in oil anything other than a bounce, not a trend change, but with a massive short squeeze likely, this could be a sharp move.

As for other commodities, Copper down over 3%, but looks like it may have had a short term capitulation event. GLD nearly flat at -.16% and SLV down -.99%.

One thing I mentioned earlier as far as Oil and the broad market goes, is that any bounce in oil should flow to the Energy complex (which is showing short term 3C positives) and that should flow to the market, even as Energy Credit negatively dislocates even worse... again, not a move I expect to be more than a short squeeze (not to diminish the power of a short squeeze-hopefully our spec USO calls will fly).

I've been very patient with UNG, as many of you know, so long as it didn't close below the $14.30 area and as long as the positive divergences kept building, I had no reason to close the position which started to pay off today with a +11.65% gain today in UNG and nearly a +33% 1-day gain in UGAZ (one of our current longs) with our most recent add to (fill out) UGAZ long up +18%, although the whole position still has work to do, but I still favor Nat Gas.

 Our recent add-to (to fill out the half size UGAZ long), now up nearly +18%.

Here's the daily chart of UNG with excellent volume and an excellent close at the top of the day's range.

Here's today's UNG update, UNG UPDATE, the charts are looking strong as far as supporting this move.

As for the levers, I showed earlier some of the divergences that suggested the levers (HYG, VXX, TLT and USD/JPY) were being used, VXX was nearly perfectly in line with the SPX as was spot VIX, TLT was leading the market until 12:30, at which time it laggged and closed in line. HYG was in line.

However as for the divergences that we have been tracking as part of our near term forecast...
 VXX 1 min near term negative as a lever to ramp the market.

 The 1 min inverse of VXX, XIV with a positive and near term confirmation.

However UVXY's move higher on a 5 min chart is still in line and not part of the lever, leaving me to suspect this is a shorter term bounce and not well supported.

 As we'd expect to see for confirmation's sake, the 5 min actual VIX futures also has a negative, this may sound contradictory vs the UVXY 5 min chart in line, but the Index futures' charts tend to be less influential i their timeframes, so a 5 min futures divergence might be somewhere around a 3 min regular 3C chart.

 Note TLT (20+ year Bond Fund) also put in a negative divergence despite gapping higher, this is why yields hit an intraday low and moved a bit higher as TLT lost ground in to the close, I suspect it loses more ground over the coming day/s (depending on how fast the 3C charts move and Leading Indicators confirm).

 The 5 min TLT chart is in line with its uprtrend so there's not that much support for a bounce higher at this point any way.

 HYG High Yield Corporate Credit , put in a positive divegrence intraday right where the market needed it to for it's afternoon turn with oil.

However the larger HYG trend has turned negative and after this smaller cycle ends, HYG and the market will be continuing their moves to the downside.

 The lever of USD/JPY (candlesticks) vs SPX futures (purple) were inline right after the open (green arrow), but ES quickly dislocated from the Fx carry cross, it wasn't until later with oil that ES made an attempt top move back in line with the normally correlated FX pair.

 I did point out the lack of ES support or bubble between it and USD/JPY over the last week, note now that ES has caught down to USD/JPY as suspected as there was no support and ES was, "Frothy".

 The SPY caught down to the leading negative 5 year yields near term...

However, the 30 year yields are a much bigger problem looking at the big picture...
Even though SPX/SPY caught down to the short term leading negative divergence in 30 year yields as well. Remember, 30 year yields hit record lows today and yields tend to attract equity prices like a magnet.

 The Pro Sentiment Leading Indicator we use (one of two) showed what appears to be yesterday's late day short term capitulation (selling event pr exhaustion event) and then started o lead the bounce today. Our second pro sent. indicator is simply in line. These are some of the indicators I'm talking about when I say we need to be patient and wait for confirmation before jumping in to shorts on price strength and underlying weakness.

 Our two newest custom indicators , the SPX:RUT Ratio (red) and VIX Term Structure (green/white) have been right on. Note the SPX:RUT indicator at the last VIX Term Structure Inversion (buy signal) , it didn't confirm SPX price (green), however the buy signal today, did see a positive confirmation ahead of time in SPX:RUT Ratio.

These should be put in to context though...
 This is a 15 min chart, note the buy signals and how big they were, how much they moved the SPX. These last two signals were either on intraday 1 min charts or today was a single day, past signals were much larger, but still effective.

One Leading Indicator that is flashing a new signal is PIMCO's HY fund, it led the market lower, it led the market higher, it has been leading it higher and today it diverged with the SPX on the afternoon move to the upside. I'd like to see this continue to diverge in to higher prices, that gives us the perfect short set-up scenario and the "CONFIRMATION" I've been talking about.

As for the averages...

 IWM 1 min intraday positive in to intraday lows, but not much beyond this.

IWM 2 min

IWM 3 min, no positive signals at all, thus the thought that this will be a short lived/unsupported bounce, an oversold bounce, but not a heavily oversold market.

 QQQ 1 min, again the 2-3 min charts are not supportive. This is not the kind of divergence I would trust to trade long beyond a day trade.

SPY 1 min in line...

SPY 2 min with a weaker form, relative positive divegrence.

 I'm not sure what to think of this small SPY 5 min, if it is coincidental or real, either way it's not very big.

 Note the intraday breadth on the NYSE TICK clearly change from lateral to up and hitting +1500 this afternoon, a short squeeze is likely.

And my custom TICK/SPX indicator shows yesterday's capitulation event (yellow) as today TICK remained broadly higher and then moved up in to the late afternoon. I mentioned this "short term capitulation" last night, there it is on a chart if you're interested. Higher volume is a HUGE plus for this kind of signal.

Other than those charts (quite a few), I have 30 year Treasury pullback confirmation, VIX pullback confirmation as you saw and ES positive divergence confirmation, NQ and TF are less so.

As for internals, the Dominant Price/Volume Relationship wasn't very telling and not clearly dominant across all of the averages. The SPX and Dow-30 were both Close Down and Volume Up with 179 and 17 stocks respectively. This is a short term oversold condition that usually ends with a green close the following day, but because all 4 averages weren't the same, take away a few reliability points and because the number of stocks were barely dominant, take away a few more points.

The Russell 2000 and the NDX100 were both Close Down/Volume Down with 835 and 56 stocks respectively, this has the least next day influence, almost none. This is the relationship I call or describe as "Carry on", as in keep doing what you were doing and at the close they were moving higher so I suspect that trend continues, although the Dominant P/V relationship in these two will have little influence over that.

As for the S&P sectors,  2 of 9 sectors closed green; Utilities (defensive) led at +.86% and Financials lagged at -1.43%, I'd look for these two to flip flop tomorrow unless something goes wrong.

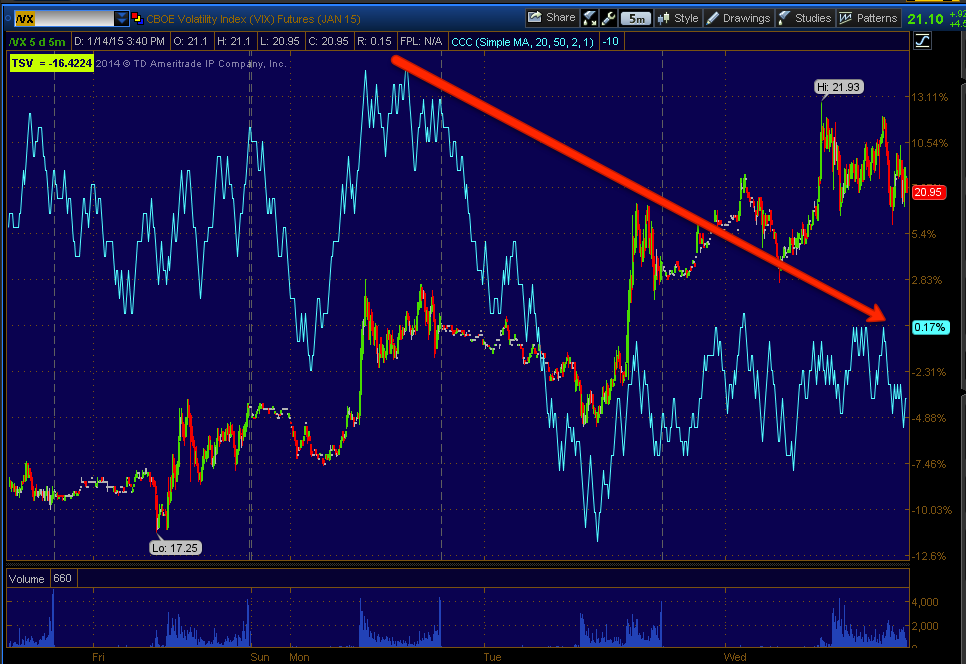
While we are on the subject, I have mentioned the rising volatility numerous times, remember this is almost always associated with a bearish change in the market and seen between every stage transition. One of the themes we see is the market becomes much less predictable so weaker divergences like we have now are much more prone to being run over, just something to consider if you are thinking about trying to play this on the long side for a short term trade.

Of the 238 Morningstar Industry groups, only 63 of 238 closed green. Again, like yesterday all of the closing internals from the Dominant Price/Volume Relationship to the sectors close, are virtually identical to yesterday,  it's not a strong oversold condition and less likely to produce a strong oversold bounce.

So that's where we stand, it's not much different than what we have been expecting and how we can play the scenario, my biggest concern is the unpredictability of volatility as these aren't especially strong divergences and not an especially oversold market condition. In fact, while this is likely nothing (I'll check futures later and report if anything is amiss), the Index futures are showing negative divergences right now, not horrible, but in this climate, everything needs to be watched carefully.

ES 1 min negative since the close.

Again, I'll check on the futures and let you know if there's anything standing out.


Patience Pays

I know some of you took this trade on the upside and in some cases are already out with a nice little gain, however for those who may be in agreement with selling/shorting in to higher prices, I'd stay patient and let this play out.

The biggest danger I see is the aggressive selling we have seen for at least 3 days in to any kind of price strength, that's reason enough for me to leave my short positions on, there are many other good reasons as well, but as far as gaining an edge and reducing risk by selling short in to strength, let some strength develop.

What I see thus far on a preliminary look-about, is enough support to take this higher. The SPY looks to have the best underlying (strongest) 3c charts, the IWM has the weakest, in fact quite weak, almost scary weak. The Q's aren't that much different.

However consider that if there's a stronger bounce in oil than what we have seen this afternoon, a lot of oil service stocks are going to do better and help the market.

I say stick to the plan, stay patient, let a trade worthwhile come to you.

I'll have my preliminary charts up momentarily.


Market Update

Interestingly, once again today the charts have been forecasting near term action near perfectly, this time less so on end of day/closing divergences and more so on internals.

From last night's, Daily Wrap

"While the Russell 2000 had no Dominant Relationship today, the rest of the majors did, the Dow with 14, the NDX100 with 52 and the SPX wwith 220, the relationship was Close Down/Volume Up. This is EXACTLY the same next day concept as the parabolic drop today on big volume, it typically signals the end of that move and the start of a relief bounce which I suspect we see tomorrow with distribution in to it.

The S&P sectors had 7 losers, 1 gainer and 1 flat. Utilities outperformed at +0.28% and Materials underperformed at -1.12%.

Of the 238 Morningstar groups, 107 closed green, the rest red.

What I like about these internals is that they are not extreme, they do point at a bounce, but not an extreme one which would fit with the 5 min charts falling apart in to some higher prices.

Additionally our SPX:RUT ratio was positive at he lows today with a small VIX Term Structure buy signal as well, very small."


The first paragraph in red is pretty much in line with what we are seeing on the charts thus far today.

The second red paragraph is interesting because as I posted this morning, we had a second signal, they are small, not like the October lows, but they seem to be pretty darn effective looking back historically and just since we've been using the new custom indicators.

I also included the charts just after 5 mins so you can see in terms of multiple timeframe analysis, what the market is set to do next and how the current cycle that reaches out to 5 min charts, is a means to the next cycle on the 10-15 min charts.

Every chart below is in line with our short term price expectations and what happens during those and what happens next (bounce, distribution in to the bounce destroying the 5 min charts and moving to a new low, thus the reason I want to be patient, wait for a bounce to sell/short in to and look for the next move lower although we haven't really ended the current move lower as of yet.

Backing up this theory are the typical market ramping levers and their multiple timeframe charts. Remember, the expectation is for a near term market bounce that will not hold and be sold in to. Here are 3 of the 4 levers...

HYG
 The intraday 1 min chart is starting to put in a positive divergence and a leading positive, this is one of the most often used market ramping levers.

There's nothing on HYG from 2 to 5 mins that is supportive, at 10 mins the larger picture/trend emerges, I trust I don't need to comment on the current divergence.

Remember this is multiple timeframe analysis.

VXX-short term VIX futures...
 intraday 1 min negative today...

And nothing to support a move beyond that as the 2 min is in line and not negative.

The 5 min is in line off a larger positive from last Thursday when we first spotted the unusual underlying activity (bearish).

TLT-20+ year Treasury Fund, which means a move lower= yields higher, stocks tend to follow yields.

TLT 1 min negative

However at 5 mins it is perfectly in line with the uptrend.

The TICK remains pretty negative today, but still mostly laterally trending.


QQQ 1 min intraday building a positive

There's also a small 2 min positive and...

Whether coincidental or not, a very small 5 min positive

The QQQ 10 min speaks for itself.

IWM 1 min positive, which also looks the best by the way.

The 2 and 3 mi charts have nothing positive going on and look like the above 3 min chart.

The 5 min is in negative position, but the 5 min chart is not completely used up, this is why we need higher prices, they won't sell in to lower prices.

 IWM 10 min speaks for itself, hopefully you understand why we want to sell/short in to any near term market upside as I have posted numerous set-ups recently.

 SPY 1 min

The 2 & 3 min charts, like IWM have nothing positive, thus implying a weak or rather barely supported bounce, it doesn't mean it will look weak, but it shouldn't be able to hold out long.

Again, coincidental or not, there's a small 5 min SPY positive.

The 15 min speaks for itself.

That's a lot of confirmation, which was built on last night's internals, hopefully you understand both our short term tactical plans and longer term strategic positioning.