Monday, June 15, 2015

Daily Wrap

Today felt a bit like a Monday at the office, not very exciting although we are in a spot where there's potential for excellent short term signals, I'd say the big picture signals are already excellent, even if you are just looking at leading Indicators, Leading Indicators Continue to Fall Off a Cliff.

I smell a set-up, similar to the one I felt just before April when I said that the market would not hold any significant downside until there was first a head fake move above resistance which had been becoming more and more defined...

SPX resistance had been becoming more and more defined, making it very obvious to technical traders, making it very easy for Wall St. to use that against technical traders as anyone who bought in the head fake area (yellow) was left holding the bag.

In a similar, but smaller way, the same kind of set-up is occurring right now, except this time with the 150-day SPX moving average.

 The 150-day moving average (SPX) is now becoming more obvious and clear as a "support" level, technical traders will bite on this set-up, they are just that predictable, so while I suspect some kind of corrective move/bounce off the 150 day, we didn't get the intraday confirmation which would set up another weak "V" shaped base, except weaker (shorter term)  than the last.


Even using traditional technical tools like the Ultimate Oscillator, the divergence in the daily SPX chart is pretty clear and right at the head fake/false breakout area forecasted as far back as April 2nd.

Intraday, like we saw in several other assets, the market went dead flat after the European close.

Year to Date the Dow (white) is now in the red and Transports (salmon) have been red.

The VIX which was shown in today's Leading Indicators Continue to Fall Off a Cliff had the biggest 2-day surge since January...

VIX 2-day price percentage change. Don't forget we also saw VIX and VXX leading the market intraday and at the close unlike last week's attempt to slam them to support the market.

Right now it looks like the Euro is strong and the $USD weak, but I posted this in an update earlier, I believe we are going to see the $USD make a near term bounce and the Euro pullback which should...
 ...Send the EUR./USD lower.

Looking specifically at FX futures...
 The 1 min Euro futures has a negative divergence so I suspect this starts soon.

The 1 min $USDX has a positive 1 min divergence, also confirmation of a near term start to EUR/USD downside.

As for how far it may go...
 The 30 min Euro chart is leading negative and the...

$USDX 30 min chart os leading positive.

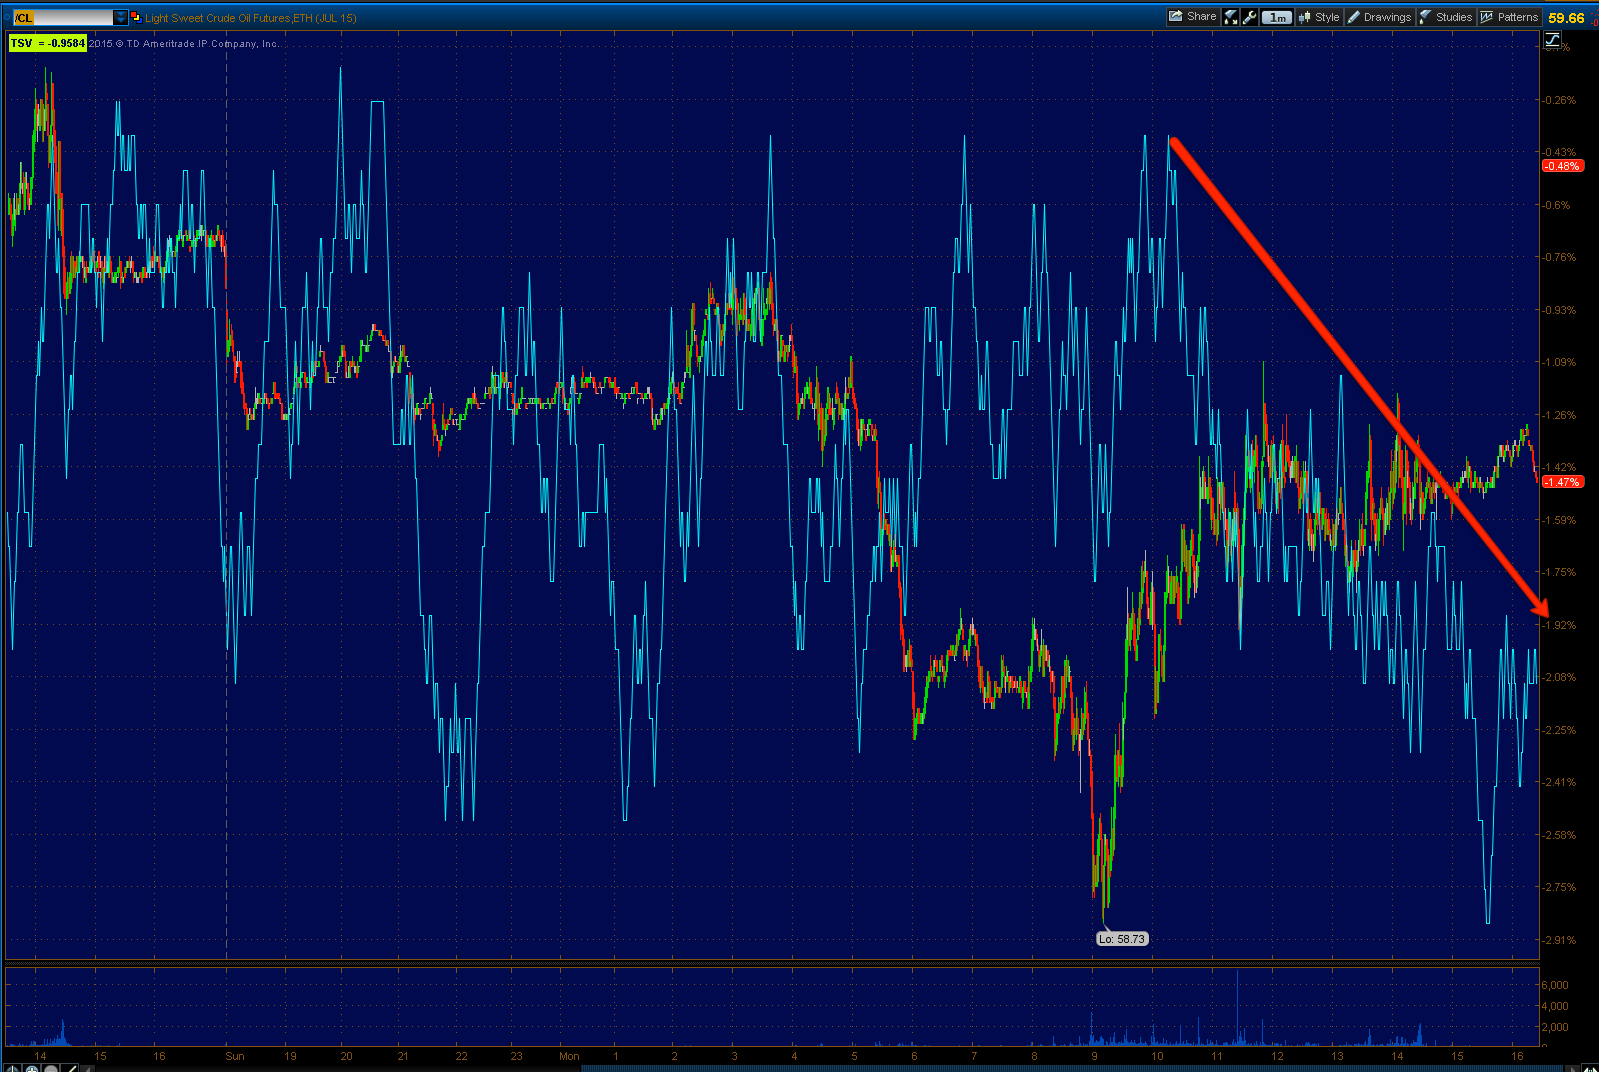
As mentioned earlier, this should help send oil/USO lower on $USD strength and interestingly...

The 1 min Crude futures has the same negative on the 1 min chart as the Euro/positive $USD as well as...

A negative 10 min crude divergence as well, that should put the USO put in decent position with a decent gain.

It's hard to add much more to what has already been posted today. Even though I suspect we should see a 1 min decline/intraday in the averages before they can move higher, if they can move higher (I suspect so because I don't think that 150-day moving average support is there for nothing, it looks like a set up to gather stops all in one place), it seems like there's some short term corrective set up with the SPX 150 m.a. as the centerpiece, as I said, to gather stops in one area.

I'll wait for the charts to give evidence rather than guess, there's plenty of time on the VXX calls and they're near a +50% gain.

HYG is in terrible shape, not just leading indicators either, the 3C charts are horrible, if there were positive intraday divergence there I might assume a bit more rather than wait on evidence, but there's not and this market is just a head line away from breaking as Greek Capital controls are already being seriously discussed and the ECB's non-monetary policy meeting Wednesday could yank all the Greek banking sector liquidity (what little is left) and really show you what a bank run and civil unrest look like.

As for internals...

All but the Dow had a Dominant Price/Volume Relationship, it was Close Down/Volume Up, a 1-day oversold condition with 50 NASDAQ 10 stocks, 972 Russell 2000 stocks, 217 S&P 500 stocks, the second place was close down/ volume down.

In this case, this is a 1-day oversold condition and makes sense given the SPX's support at the 150-moving average and "hammer-like" price closing candle, I'd still prefer to wait and see the actual moment with the intraday charts turning down and then going positive on short term charts before making any moves as this is a very weak and dangerous area for the market, it's not an area where I think "Gut feeling" is a good way to conduct analysis.

The number of stocks in each of the majors > than their 50-day is very poor, only 9 Dow, 39 NDX, 972 R2K and 173 SPX.

Of the S&P sectors, only 1 of 9 closed green,  again a 1-day oversold breadth condition.

Of the Morningstar groups, only 23 of 238 closed green, AGAIN A MASSIVE 1-DAY OVERSOLD condition. I see no reason the market shouldn't correct from here, but if anyone remembers Lehman, there were plenty of days the market had EVERY reason to correct and some news came out that wasn't discounted and down we went, trying to play counter trend bounce at the start of the bear market was a very dangerous game, thus the reason I want evidence rather than just gut feeling or probabilities.

Should we get the evidence for a bounce or even a corrective bounce off the 150, remember there's a roof on it with the VXX 5 , 10 and 15 min charts....

 VXX 5 min leading positive

VXX 10 min leading positive and it looks like the head fake for a reversal's timing is also in.

I might have a very difficult time taking gains (short term) on VXX calls with charts like this looming, it certainly doesn't look good for the market.

As for futures, it's a bit early, but the ES intraday chart doesn't look good here.
This is an even narrower, sharper "V" bottom than we saw last week, however ES 1 min has gone deeper leading negative since the close, maybe it comes down overnight...

I'll check futures later tonight and let you know if there's anything exciting. Otherwise, I think the message of the market should be pretty clear by this point.

Have a great night.


VXX Call Position Update

As seen in Leading Indicators Continue to Fall Off a Cliff just moments ago, VIX/VXX have been leading the SPX vs the normal correlation. As I said earlier today, I'm going to be patient and wait for a reason to close the positions if it is there, otherwise I see no reason not to keep them open.

This is VXX actually leading the SPY in to the close...
My alert system for VXX keeps going off as it makes higher highs intraday and in red, is nearly moving with or leading the SPY.

The best near term information I have as far as options trade management is that we should see an intraday move to the downside in the averages before they do much, this isn't 100%, but it's the probability...
 SPY 1 min intraday

ES 1 min intraday showing the same.

Thus holding VXX through today's close was the right thing to do and I have no evidence that short term it still not the right thing to do.

The position closed at $1.89 bringing the current P/L to  +47.5% and there's still tons of time (July 17th) until expiration.


Leading Indicators Continue to Fall Off a Cliff

This isn't really  a new story, it's kind of picking up where we left off last week with Leading Indicators Not Helpful For the Market's Bulls.

I don't see any of the charts below as an impeachment to a very short term corrective bounce with support at the SPX 150 dsma, although I don't see them allowing much of significance beyond that.
 SPX daily chart w/ 100-zma (yellow) and 150 sma (pink) with support at the 150 sma today. #1 the head fake/false breakout, #2 the reversal and break of the 100-day, #3 support at the 150 ska, #4 the 3 candlestick downside reversal pattern, #4 a slightly bullish daily candle with support the 150-ma.

From most technical traders' perspectives (keeping in mind sentiment is very bearish right now, thus set up to flip sentiment and create opportunities, the second area of support at the 150 defines it as a support area with stops just below, thus any bounce from here will likely slice right through the 150-day on the reversal back down if they pull a bounce off here. Psychologically, the 150-day just became the focus of technical traders and the area where the most number of traders can be fooled.

Last week when the market was trying to bounce off the 100-150 ma's, we saw VIX slammed to help, it's the opposite this week...

 SPX (green) prices are inverted to show the normal correlation and it appears there's a solid bid under VIX/VXX, unlike last week's slamming of both assets to support the market's bounce/correction.

 The same thing today in short term VIX futures.

High Yield Corp. Credit is lagging the SPX so again , like last week, it's not being used to lead the market, rather it is leading the market to the downside, but it's much worse than it appears.

Here's a 60 min chart of HY Corp. Credit vs the SPX, a major Leading Indicator dislocation. Typically market prices will revert down to HY Credit,

 Pro sentiment intraday, like last week is not willing to chase ANY risk, not even intraday, which is what I said as well earlier today.

On a longer term basis, the leading indicator's dislocation is very large, this is major trouble for the market and very indicative of a top.

Here's a second version used for confirmation with the same signals.

It has seemed like 30 year yields (red) have been leading the SPX both up and then down and now they have both reverted to their mean. I would think a short term TLT pullback would send yields higher, but the counter trend rally would send them lower which if there is still a leading correlation between yields and the SPX would mean a very short term bounce of a day or two and then a strong momentum move down which actually fits nicely with the 150-day assumed support and slicing right through it.

And commodities have seemed to lead just like yields, first up and then down and now reverting to the mean in green.

HY credit with no short term manipulation of price continues to be in risk off mode.

And the larger picture there as well, also a problem for this market.

Market Update

Today's price action and signals have been fairly dull, but the first thought I had as morning trade burned off is still the same thought/expectation I have now and a large part of that is due to VIX short term futures.

There's an incredible capacity for the market to be moved at a moment's notice right now with any Greek headlines or rumors and then of course Wednesday we'll likely see the typical F_O_M_C knee jerk reaction, unless my gut feeling on this is correct and we get our first hike in June.

In any case, from a chart perspective...

 SPY 1 min intraday. As early as the pre-market A.M. Update  said we'd likely see a bounce off today's gap down, which is not a very unique or talented call, there's a gap, it's likely it gets filled. However I also said that I would not trade this even intraday, the profit vs. risk is just not there as the base/positive divergence area from this morning is really not large enough to give you any kind of an edge, at least not compared to the risk.

The intraday chart still shows what I believe to be the highest probability which is a pullback toward the opening/A.M. lows around the white trendily,  it is there where we'll get the next goof batch of data as to whether a stronger base/divergence is put in in which case I might look at closing VXX calls and/or maybe some short term trades in the averages for a bounce, but I mean very short term as in day trade or a day or so at most.

 The ES/SPX 1 min intraday futures has the same signal as SPY 1 min above, also suggesting a pullback toward intraday lows, how the charts react on such a move is the next important piece of data for us with regard to very short term trade.

 The 3 min SPY chart is in decent shape for a day, it's still not anything very exciting, but if it were to add to its base near intraday lows, as I said, I'd probably close VXX calls for a short time and maybe consider some other short term TRADES.

However put the same 3 min chart in context and you see this is really nothing special...
 Several bounces have all ended badly in the same timeframe of SPY.

The VXX 2 min chart is showing intraday confirmation which I'm a little surprised at, I thought it may stay weak on the 1-2 min charts today.

It's this leading 5 min chart that tells me whatever happens with the market averages, it's either not good or very short lived as VXX trades opposite the market and has a strong 5 min leading positive chart.

Beyond that the VXX 10-15 min charts look excellent, which would have the opposite meaning for the market averages as they trade opposite VIX/VXX.

 The QQQ 1 min chart looks like the SPY and ES 1 min chart and also looks like a near term pullback toward today's intraday lows, there we can see if there's any accumulation intraday or whether it's just ugly.

 Like SPY 3 min, QQQ 3 min also looks good intraday, but again this is only a 3 min intraday chart and if it were a base, it's less than a day, a "V" shaped base and you saw what happened to the last attempted bounce off a "V" shaped base last week as it failed and made lower lows.
This is why a pullback to the intraday lows would give us a lot of information and a very good idea of what to expect very short term. I think the VXX 10-15 min charts give us a very good idea of what to expect beyond this very short term trade and it's not good for the market.


 The QQQ in the same timeframe as the VXX 10 min leading positive is in a 10 min leading negative divergence which is additional confirmation of how any very short term move, if the market can get it together,  ends...

 The intraday IWM like SPY 1 min, ES 1 min and QQQ 1 min also suggests a near term pullback to this morning's intraday lows.

 As does Russell 2000 intraday (1 min) fruits like ES. The yellow trendily is where I'd like to see price just to get a feel for how underlying short term trade is reacting.

Again, like the 5 and 10 min chart (negative in the averages/positive in VXX), the IWM 5 min is leading negative so it doesn't have a very strong looking future even on a very short term basis, but until we get a pullback toward the intraday lows, it will be difficult to add much more detail unless we get some new/additional signals, but thus far this seems to be it.

The TICK chart has been a bit more volatile than I would have expected based on price action alone...
There are several +1500 moves in TICK which is surprising given the flat range through most of the afternoon. On the downside, while not as strong, there have been several >-1000 tags, which is also a bit surprising.

This market is a bit more volatile than it looks.

Again, this all tells me that the highest probability path right now is patience, I sure wouldn't have wanted to chase price and be stuck flat all day in the market on such a sharp "V" pivot. That's a lot of risk for what we already know statistically is very little reward.

TLT Position Update

This seems to be another great example of, "Patience Pays".

As you probably know, I'm looking for and expecting a strong counter trend bounce/ra;;y in TLT (20+ year treasuries- 30 year Treasuries). however before I could add a call position in addition to an equity long (short TBT-2x inverse TLT making a 2x long TLT position), TLT took off to the upside the last 2-days, but rather than chase it, I thought it best to just give it some time and it would come back to us, giving us a better long entry, a much better call/options entry and much better timing, the signs of a pullback or correction were there, now there are standing out.

This is why I don't chase trades, so long as there's a reasonable amount of evidence to suggest patience is the best bet, it's often worth it. This is much different than "hoping" it comes back.

As flor the longer term picture of a TLT bounce/counter trend rally...

 TLT daily chart with a channel buster/support break. There are a lot of Treasury shorts which is great initial momentum/fuel for a counter trend bounce/rally back above the long term trend line.

The last couple of days TLT has been up, I'm not one to chase an asset and believed it would come back down and offer us a better entry. Here TLT has met resistance and has a small reversal process in place suggesting there's a good chance of a pullback, giving us that call / options (or long) entry I've been looking for as the baser area matures.

Looking at the charts, it looks like this is a probability, from the shortest term, intraday or near term action first..
 The 2 min negative divgerence suggesting the near term pullback I've been expecting.

The same in the 3 min chart

While the 5 min chart is leading positive suggesting the basing area is nearly complete, there's a small near term relative negative divergence (red arrow) suggesting the pullback I've expected.

And despite a larger positive divergence on the 15 min chart, near term action shows a small negative suggesting a pullback.

The longer term 30 min chart shows the two areas of accumulation I consider to be 1 larger base, so I think the counter trend bounce/rally is still on.

As for 30 year Treasury futures... Starting with the bigger picture longer term charts and working down to short term action...

 60 min 30 year Treasury futures (/ZB) with the 2 positive divergence base areas I believe are 1 larger one, supportive of the counter trend rally theory.

The 30 min showing the positive at the right side or second base area.

And the 15 min showing the same with a weaker, smaller relative negative suggesting a near term pullback for our long entry/calls.

The shorter term 7 min chart suggesting a pullback like USO short term charts.

As well as the 5 min /ZB chart

And the 1 min intraday.

I'll be setting price alerts for reminders to look at TLT on a pullback for an entry area, likely calls in addition to the partial 2x long TLT position already in place.