I've been looking for a pullback in GLD, that started yesterday and continues today with a gap down. I DID NOT put out a short trade, I don't think GLD should be traded from the short side right now, I think any price weakness with 3C strength should be considered to be a buy. Recently we've had 5 in a row successful quick trades in GLD, for each of them we let the stock come to us and traded in the direction of highest probabilities based on the underlying trade.
So I'm watching GLD for further downside and positive divergences in to that downside, there are a range of possibilities here and what the F_O_M_C and ECB do today and tomorrow respectively, could have a HUGE impact on GLD, that is another reason not to get too caught up in GLD with such a wild card unknown, that's basically gambling-betting on red or black, we want to trade with the probabilities and step back when there aren't high probabilities or wild-cards that we can't predict.
In any case, here's what we saw in GLD, what we are seeing now and some ideas for how to play this.
The 1 min chart looks pretty much like confirmation of the move in GLD over the last few days, there appears to be a small negative divergence intraday as GLD has moved up in to the gap, I would think GLD will be one of the ETFs that sees a lot of volatility on the F_O_M_C announcement.
The 2 min chart has been looking like a pullback was likely as it has been in leading negative position for the last 3 days and today as well.
The 3 min chart-and this is what I like because I was expecting a pullback, not an all out sell-off in GLD, the 2 and 3 min charts and their trends have been deteriorating as you can see happened here Monday and Tuesday, showing higher probabilities of a pullback and then we get the gap down this a.m.
At 5 mins, we have an overall negative relative divergence, but there is some positive activity the last couple of days, it will be interesting to see if this builds as this could represent some bigger orders starting to come through as price weakens. It also could be a bit of noise, but that's why we keep an eye on it, the reason I suspect it may not be is that I was expecting a pullback, if the 5 and 15 min charts were really bad, that would indicate the probability of a sell-off rather than a correction.
You can see something similar on the 5 min chart.
Now this is where it gets a bit confusing and it has been for me too, GLD has shown some extraordinary 1 day moves in 3C on the 30 and 60 min charts, we have played some of these for short term trades and did well, these are typically NOT timeframes that express probabilities of short term moves, but for the last 2+ months, they have been and doing so very accurately.
The 30 min chart takes a lot of noise out of the trend in 3C and shows a clear negative divergence and GLD moves down, the positive divergences moved it up as well to the left. Right now the position of the 30 min is interesting and I wonder if GLD will see an pullback capped off with a volatile move before a reversal to the upside, that would present a GREAT opportunity.
The 60 min chart's overall positive bias and WHY I want to trade GLD from the long side, but I want to buy price weakness, not chase price strength.
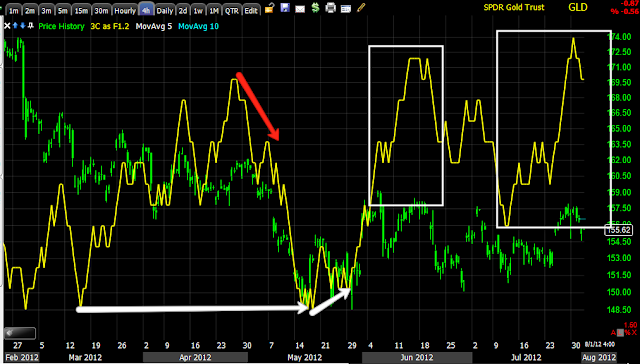
The 4 hour chart is also overall positive and this goes to what I was showing you yesterday on the daily chart in which GLD "looks" very much like it is preparing for at least an intermediate and maybe even a primary up trend.
Because we have a bear flag and a diamond and probably several other price patterns as well as support below, it's hard to tell what traders are paying attention to, that is why my pullback range is so large, maybe below the diamond, maybe even briefly below support, if we get a move below support and have strong positive divergences, I'd say we are closer to a long term long trade in GLD, but we'll continue to listen to the message of the market rather than try to guess. We tend to be ahead of the herd any way by just paying attention.


