Monday, September 23, 2013

Lots of Stop Runs

What do they do before they make a move higher? They take your shares on the cheap. "Head fake" is a general term encompassing a lot of different tactics including false breakouts, false break down, stop runs, limit triggers, etc, just about anything that "looks" one way according to price (and this is why I say, "Above all else, price is deceptive").

Right now I'm seeing a lot of stop runs, it's not just so they can say, "All of your shares are belong to us HAHAHA!!!", it's because 1) it's the easiest way for them to accumulate quickly without raising any suspicions because for some unknown reason, whenever there's a big stop run like that, traders just assume their shares just disappeared, NO! There's always someone on the other side of that trade and when you get big volume on a 1 cent stop run, someone just took on a lot of shares cheap. 2) It's a momentum thing, shorts enter, longs who were stopped out go short (that's one of the most brain-dead concepts of Technical Analysis) and when the former support area (where traders always put there stops at as predictable as the sun rising tomorrow morning) which is now resistance is broken, you get a massive short squeeze and who ever took the other side of the trade is making nice money on cheap shares and finally 3) in large size.

I'm seeing a lot of stop runs, it's making me think that scenario 3 or the last scenario ("W" bottom) is high probability.


Time to think like a crook.


Take a look at XLF and tell me, of you could (and they can) move this a little, where would you take it.
Look at all the volume earlier today, that's like 4 or 5 days of normal accumulation all at once, EASY!

The support area to the left on the upper trendline is $20.11, guess what the intraday low was in XLF and look at volume the rest of the day before you answer after the initial gap down stops were run?

The answer is $20.11, the stops would be placed "ON A BREAK OF $20.11" or below support, all day today $20.11 was support so those stops were never hit, at least....NOT YET!

There's one more zone that is within reach, the second trendline below the first, that's a gap and the stops would be somewhere around $19.96. Notice anything else, give you a hint, it's psychological?

That would be one of the most obvious stop levels of all, $20 even.

I see some interesting things, still totally in line with the Yen trade, the 3C charts, basically the idea of "This isn't that much of an impressive set up for a big move higher", but in looking at HYG's 3C chart, I think it's just as if not more probable than when I first expected something from it last Friday.

The PMS are in play, someone sent me FFIV which looks like there's no way from a daily chart, but that all happened early in the day and it's been lateral the rest of the day, so there are a lot of assets that have either run the stops already or like XLF, are a penny from it.

I think we get the move, I think I'm setting alerts for stocks like XLF under the stop levels of $20.11, $20 and $19.96. Of course I'll double and triple check 3C and the correlations, but this is now becoming a cleaner, less risky set up, I'm glad I didn't do much today other than clean up some shorts/puts.

I think tomorrow there will be lot of game to hunt, again if you'er nimble, otherwise I'd just wait a bit more and let the market do what it will do and use that to your advantage on core positions.

More to come, but as I looked through the watchlist before the close, almost every asset had an area that I'd set an alert at an be very interested in buying on a head fake / stop run move.


Another Market Update

My apologies with so many market updates, but I'm just being super cautious right now because what I see screams "Weak Market" and just like retail flocks together in a herd, Hedge Fund and other managers do the same, in their field as long as you are in with the average return of the crowd (even if negative), the presumption can be passed along that it is the market and not the managers, but anyone who dares to try to do better and fails, they will stand out from the herd and lose a very well paying job, it's for this reason hedge funds continually underperform the SPX every year, most losing money every year and the exact reason they herd together as well.

The danger is like what happened with AAPL, one of the daring Wolves on Wall Street, Dan Loeb doesn't follow the herd, they follow his First Point Fund, when he sold, the herd didn't stick together, it became every manager for themselves and AAPL lost -45 % because of it.

This is why I'm being super careful here to make sure there's something solid to stand on before putting a foot out the window.

As for Leading Indicators (*For newer members. Leading Indicators are always compared to the SPX in green unless otherwise noted).
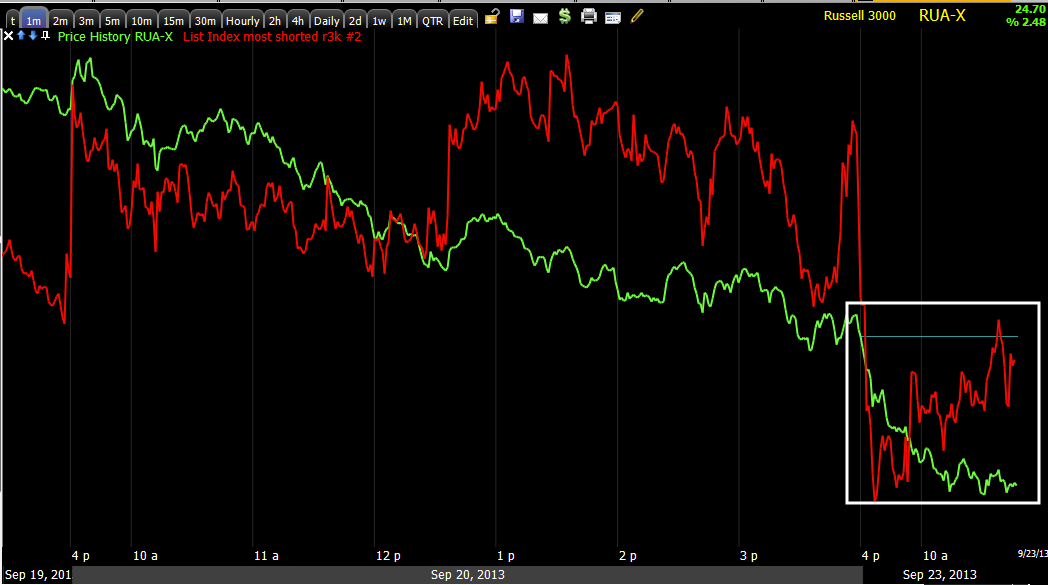
 This is HYG Credit, High Yield corporate and the most liquid, that's why it's one of the 3 assets used in SPY Arbitrage, when smart money go long, they usually do it in something like High Yield Credit.

This is intraday, you can see why the SPY Arbitrage is having so much trouble today, HYG failed to make a higher high just around the same time the Arbitrage fell apart as support, that was the first time around12:45, the second time was even worse at the right of the red arrow. This has me a little edgy about playing any longs because the term of the move must be short so to play it, leverage is likely needed, but I want to be as sure as I can be before deploying leverage.

There are a couple of possibilities I mentioned last night, I'll get to them.

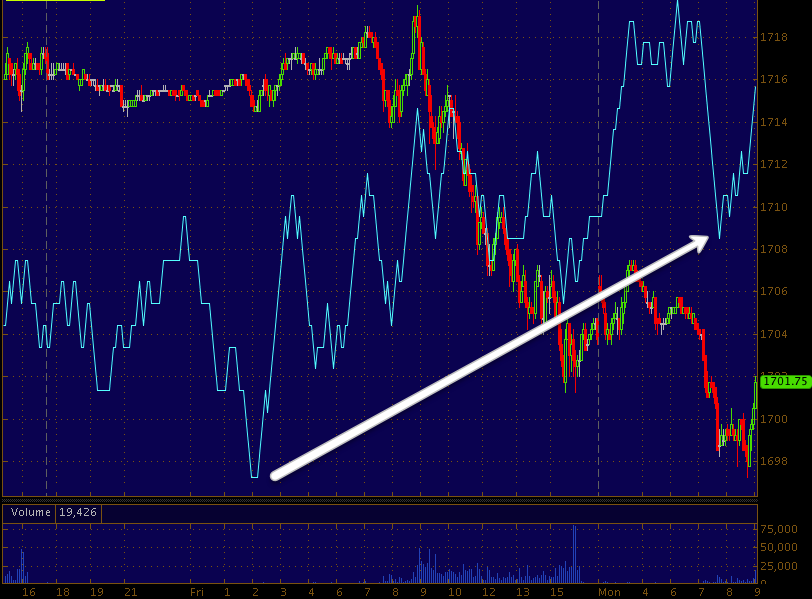
 This is a slightly longer perspective of HYG and it looks worse.

However if we go out a bit longer (even though ultimately HYG is dislocated far below the SPX as part of the primary trend, the next move I can foresee beyond this intraday scribble, seems to share a lot of charts in common with a 10 min HYG that is positive vs the SPX, so it seems like intraday there will be some noise, struggle, chop, etc, but that target above suggests after this is straightened out,t he move that I was talking about Friday is pretty likely, If the hedge fund herd doesn't fragment.

 The more skittish  (because of low liquidity) High Yield Credit looks better today than the SPX, it's leading the SPX, so this looks excellent for a move higher, again that doesn't mean anything special, it may just be to fill that gap, but whatever it is, there's not much support anywhere for anything other than a quick move.

Even Yields which lead the market like a magnet, when they become dislocated, the SPX tends to be attracted to these 5 year Yields. In green they are moving in tandem earlier today and now they are leading the SPX a bit.

 From left to right, Yields are positively dislocated (white) and lead the SPX higher, then they become negatively dislocated and badly, this is where the market had a top signal confirmed Friday, so Yields are pulling the market up intraday, but I don't ecpect that to last long, when intraday collapses, the gravitational pull on the SPX from these longer charts will be a problem.

 This is Short Term VIX Futures, VXX, vs the SPX, however I inverted price for the SPX so we can more clearly see performance of VXX, it's clear to me that traders aren't that scared here as it doesn't look like VIX futures are bid as you can see in VXX's relative weakness.

Again, this is a short term (intraday signal, but it's a signal).

Remember the Currency Carry pair, AUD/JPY, well you saw JPY already, FXA is a proxy for the $AUD and you can see it was in line with the SPX to the left and now it is leading as a single currency, the pair moves as well, so this is very short term bullish for the market.

 SPY distribution in to the F_O_M_C and the positive divergence I noticed last Friday.

Note the bear flag, actually it's not a true near flag, it's a bearish flag, but there's 3C positive divergenceS there.

Technical traders take the bear flag the opposite of the bull flag, they expect it to break down to the down side, but last week I explained how they expect a bull flag to break to the upside and thus far that flag has failed as I would 95% expect as WALL ST. USES TECHNICAL ANALYSIS AGAINST YOU BECAUSE THEY KNOEW WHAT TECHNICAL TRADERS ARE LOOKING AT AND HOW THEY WILL RESPOND.

Being we already know how Wall St. will use a pattern like this and further evidence of the 3C positive divergence, I'd say it's fairly certain a breakout to the upside is going to be seen, causing shorts to cover and reverse to a long position, longs will buy on a breakout. We could even get a Crazy Ivan with a downside break down that retail shorts and then a head fake and move higher and break above the bearish flag, causing a short squeeze and a stronger upside move.


 The 2 min IWM chart shows the flag with a small upside channel buster, you know what happens with these, typically a downside reversal, so that leads me to...

There's a third possibility and it can mix any of these possibilities in with it, that would be....

We have a channel buster outside the top of the flag already, most traders treat this as a failed bear flag and technical analysis teaches them to go long, however we know these channel busters head in the opposite direction (down here) and I'm thinking there could be a break below the bottom of the flag that draws in shorts, causes longs to cover and then it breaks out for real to the upside on the move we suspected since at least Friday when we saw it *maybe Thursday it started forming?)

The last possibility is that price pulls all the way back to today's morning lows and creates a small "W" base, that would support an upside move better. There would probably be a head fake move below the "W" support, I drew the possibilities in. First we already have the channel buster, second a head fake at the break below the flag in a yellow circle (middle one), then we could see a move to support as defined by today's intraday low,  just before price takes off(assuming 3C is still confirming accumulation), then we should expect an 80% chance of a head fake below the "W" base's support (last yellow circle below yellow support line).

If that were to happen and 3C confirms still, I'd look at this as a much better move to buy, even as a short term trade.

Important Market Update / YEN Currency Carry

This is another post from Friday that is coming true just as expected and this is another example that should help you understand the difference between short term moves, mid term and long term and how they work together, what they mean to each other and even how strong a move can be.

In this update from last Friday Market Update, I was talking about the engines they'd need to push the market, SPY Arbitrage or one of the 3 Currency Carry Pairs, since the Japanese Yen is the "short" of all 3 pairs, it is key to any support the market gets so analysis of the Yen is important. I said the following...

"However, maybe the most insightful chart was that of the Yen. The importance of a positive divergence in the $AUD and Euro is that if the move to the upside strongly on the 3C 5 min divergence, then they can cause a carry cross to move up like AUD/JPY or EUR/JPY. For this to happen, the Yen needs to either move DOWN or move up a lot less slowly than the other currency (AUD/EUR).

Here's where it got interesting, the Yen 5 min is in a positive divergence, but also at a low as if it is in a reversal process. The 15 min chart is positive too, but the 1 min chart suggests the Yen falls back toward the bottom of the most recent range where it's creating a reversal process, this would give the carry pairs a short window to move up and push the market as that's what they are used for since they truly died earlier this year. However when the Yen recovers and starts accumulating and moves up on this reversal process, the carry crosses will likely falter and market support will be gone.

In other words, there's a short window forming for a market move to the upside, but it is capped by the Yens likely larger move to the upside coming, it's just near a downside correction to build a larger upside reversal base and that correction is what the market can use as an engine to push it as shown last night."


The two engines I was talking about were either the Currency carry pairs for a short duration because they are already done or the SPY Arbitrage, the S.A. isn't working today...
 So, is it any surprise that the Currency Carry trade is being used and it's not so much $AUD strength as it is the situation I described above, 3C was telling us the highest probabilities for the Yen and here they are as it predicted.

 1 min intraday sees the Yen fall after the SPY Arbitrage Fails, it's almost as if they switched from the SPY Arbitrage and when it started to fail, jumped over to Yen based Carry trades.

 Recall in my analysis last week that the Yen "Pull back" or correction was short term only so the window for the market to rally was also brief because although the 1 min chart showed a probable pullback in the Yen which we are seeing now (supporting the market)...

 The 5 and 15 min charts are positive and trending up in a new trend, so any help the market gets is from a TOTALLY NORMAL correction in the Yen.

The daily chart of the Yen shows strong accumulation, I wrote two articles in April, "The Currency Crisis" and both are linked on the member's site. My opinion was the Yen would go up and the market would go down at the same time, I mean seriously up and down.

This Daily positive divergence in the Yen suggests a strong move higher, if I was right, the market will see a horrendous move down.

In any case, the market upside is very fragile because as of now, it is relying on a normal pullback in the Yen and there's a longer 5/15 min uptrend established which will re-establish and the market loses ALL carry support.

XLF / Financials Update

I already have an October $20 call so I don't have plans to add at this time considering the risk. If the charts improve enough that I trust it, I may look in to adding. This is an area that if I wanted a new XLF Call (short term trading) position, I'd feel fine with taking it here.

Earlier I closed the FAZ trading position that was opened for this very specific reason. FAZ is a 3x short Financials ETF, if I were looking for a short term position in Financials long using equities/ETFs, I'd be looking at adding FAS (3x long Financials).

In a case like this, because I expect the duration of any upside move to be very limited, I prefer more leverage, FAS is a good alternative if you don't trade options, but I'd use something like FAS for a trade I'd expect to work for a week or longer.

Also remember as I said Friday the only areas seeming to get any bullish accumulation attention are those that have the most influence on individual stocks so that is as I said Friday, the main averages and the main industry groups, the 3 heavies being Tech, Financials and Energy. Thus far, i favor Financials and Energy over Tech.

Here are the charts for XLF (Financials 1x)

 The rounding bottom today is very clean, a typical upside reversal pattern, but there's previous support right at $20.11, to hit those stops XLF would need a move below $20.11. I'll probably set an alert and if we get a head fake and price concession, XLF may look more attractive to me to add risk.

The action in to at and after the F_O_M_C, again, the concept of the F_E_D related Knee-Jerk move is AS CLEAR as possible here, this is why I follow objective information and not the emotions that traders have when they see the market move up as it did last Wednesday.

The 3 min leading positive is enough for me to justify holding current XLF long (calls), I think I'd need to see more to add to that position, a move below $20.11 may provide that.


 At 5 mins, there's no migration of anything positive. If you look at volume, you can see this move in XLF down today and under recent support and the F_O_M_C gains, triggered a lot of stops as well as brought shorts in, this is one of the functions of a head fake move. 

However, once again the point being is there's not even a strong 5 min positive in the Industry group which is one of the assets being accumulated for this move, which I described as probably looking like "Noise" on a chart to most people.

The 30 min XLF chart rules all of the charts above, the leading negative hitting a new low in August was bad news, the fact 3C couldn't confirm on the F_O_M_C shows how strong the overall distribution has been and EXACTLY WHY GETTING THOSE POSITION OR CORE TRADES READY, THIS IS THE TREND TO BE TRADING IN MY VIEW or at least be ready to .

Charts / Update

Hopefully the charts of ES will better expound on the multiple timeframe analysis in which we can have a bearish very short term, a slightly longer bullish move setting up that we may be buying in to as the longer chart actions shows price moving down, the shorter term charts are showing it getting ready to move up, however and here's where it gets tricky (As I say, Nothing is more deceptive than price), any upside move is destined to fail, we can still trade it and make money if we are sharp and fast, but the move itself is simply meant as a primer or a fuse of a larger bearish move to the downside which is represented on the longest/strongest charts.

This is what I was trying to explain in Thursday's video., how you can trade different timeframes long and short at the same time (long for a very fast move to the upside, but very short in duration so we use options), while that sets up head fakes and heavy distribution in core shorts which are being entered as well; it can be even more complicated than that, but lets stick with that.

ES/SPX Futures
 ES 1 min intraday is in line for the most part with the downtrend, there's a slight bump in price, but 3C is not following it, this is 1 reason I suspect a small intraday pullback and that is what I was talking about with regard to closing puts and whether waiting for a little downside here really makes sense or not, it's actually a petty decision.

The ES 5 min chart, despite the intraday, has already put in a positive divergence and this is what we saw last week forming so it's good for some upside, note that it really didn't pick up until the supply was available from all the longs who were long the FOMC who would now be at a loss as the knee jerk reaction failed.

YOU MAY RECALL I SAID YOU'D HAVE TO HIT THE BUY BUTTON IN 1 - 150TH OF A SECOND TO CATCH THE KNEE JERK MOVE, THERE WASN'T ANY REAL UPSIDE AFTER THAT SO ANY ONE WHO CHASED THE KNEE JERK MOVE WOULD HAVE HAD TO EITHER HAVE ALREADY BEEN IN BEFORE THE FOMC AND FEW PEOPLE EXPECTED THEM TO DO WHAT THEY DID SO I DOUBT MANY WERE LONG OR THEY WOULD HAVE HAD TO BUY AFTER THE KNEE JERK BECAUSE IT MOVED UP IN FRACTIONS OF A SECOND. THIS MEANS ANYONE CHASING THE MARKET MOMENTUM IS AT A TOTAL LOSS AS ALL OF THE FOMOC MOVE HAS FADED, THIS IS WHY WE DONT CHASE.

 ES 30 min is clearly negative, this chart migrated from 1 min to 30 min so it's a real, strong negative divergence. The 5 min chart may look good above for an upside move, the divergence may look strong, but a 5 min chart is scissors to the 30 min chart's rock, scissors always lose against rock in "Rock, Paper, Scissors".

Even though this 30 min chart it telling you a lot about the 5 min positive and the fact it doesn't have much behind it, there is a reason for its move and it is tactical for Wall St.


ES 60 min,  This chart was already negative in to the FOMC, smart money sold in to that spike, up and judging by the 3C divergences I put my interpretation of the strength of distribution at  different areas.
Down is the highest probability, long term trend, that's the one I want to prepare for the most.


SPY intraday 1 min was positive and now relative negative suggesting a small pullback or consolidation

The 2 min chart continues from last Friday and I'm thinking the yellow zone is the minimum upside target.

Again, note distribution in to the F_O_M_C and how ALL gains were retraced and this was a knee jerk reaction.


SPY 5 min though has no strength at all, so again there's very little hope for longs, but some money can be made hitch-hiking, it's probably better spent on core shorts, but we need the price move up first for those to be in best position.

 1 min chart improving today on the Q's, strongly suggests today's move below F_O_M_C support was as I said earlier, a head fake move.

 QQQ 2 min

Yet the 10 min shows any upside move from the charts above is really chasing crumbs, it can be worth it in the right area at the right time, but I'm trying to put things in perspective.


Quick Update

Intraday we should get another move toward the downside and probably soon, I'm not sure whether it will matter in closing those puts to try to hit that move as decay is probably just as big of an opposing factor and volatility.

In any case, it may be worth some calls or leveraged longs though, but again I have to stress the risk on long positions here is pretty high and it's crumbs, not a swing trade of a week or two, it looks like real crumbs, almost market noise.

If I were a swing type trader, I wouldn't get involved at all.

That being said, any market upside should set up some core short positions, THAT'S WHERE MY MAIN FOCUS WOULD BE RIGHT NOW, THIS IS THE MAIN TREND, THE POSITIONS THAT ARE SWING AND MORE LIKELY TREND.

I put out a number of ideas because we have a number of different traders with different degrees of risk tolerance and differing degrees of time they can spend watching the market, any short term trades (mostly anything levered via options or ETFS) is going to be short term and you need to be able to watch them closely as they'll likely end fast.

Core short or even long positions are a different story, those are the set up for the primary trend and some that set up already won't see better entries, their best entries came and went, but there are still plenty that are just a fraction r a few percent away from their best entries, IT'S NOT SO MUCH ABOUT GAINING AN ADVANTAGE OF A FEW PERCENT ON PRICE, IT'S THE TIMING, THE LOWER RISK AND OF COURSE THE BETTER PRICE POSITIONING.

KEEP THIS IN MIND AS DIFFERENT OPPORTUNITIES ARRISE.

Closing Remainder of Puts: XLE, XLF, IWM

These are all October, I'll take a loss on all, not too bad, but I think the capital is better deployed elsewhere for now and it's worth it for me to clean these out even though I think most would be fine if I waited as they are October, but I don't think it's the most profitable path, I'd rather just get out of any more draw down and Theta (time decay) and get in line with the market short term.

The Industry groups that I said were being accumulated on Friday along with the market for an obvious reason, those are the 2 assets that have the most influence on the entire market so why bother with individual stocks for a small move that really is probably not worth it in the first place and why bother trying to push the market (spend more capital ) when all they need are the two most influential forces on individual stocks.


As such, I can see charts developing nicely with positive divergences, beautiful reversal process (although short in duration and thus move). I'll try to get some up, there's a good chance I add to some calls and maybe initiate some new ones.


Closing Small FAZ Trading Position

Market Update

The intraday charts still don't look very interesting in either the averages or the Index futures except for the DIA. The TICK is also positive. The 2 min charts are positive and clearly accumulated at head fake levels as you'll see with the SPY chart with volume. I think it will likely reverse soon, but not quite there, while progress is still being made as the 2 min charts show.

DIA 1 min is showing a leading positive 1 min divergence.


The DIA 2 min chart shows the F_O_M_C move to the upside and then how it was faded as a knee-jerk reaction, this is so very typical.

 The SPY with the F_O_M_C move to the upside, ZERO follow through the next day and distribution on the initial opening gap, then note the volume spike as the bull flag was broken and the 3C positive divergence, this confirms what I've been saying as to why they (Wall St.) need these head fakes, they need the volume and no one ever suspects thre's buying on a stop run BUT ITS ONLY COMMON SENSE, WHO WOULD TAKE THE OTHERSIDE OF THE SELLERS' TRADE?

There's accumulation again as the entirety of the F_O_M_C gains are wiped out.

 QQQ 2 min distribution in to the F_O_M_C rally which we already knew about from the Index futures which are negative out to 60 min charts as the price move went higher.

***Smart money didn't sell in to the move down, they sold in to the move up where there was demand, this is why the market churned sideways after the initial spike, retail demand could never overwhelm institutional supply.

Overall the trend of positive 2 min divergences continues.

This is a good example of a head fake opening gap up that is distributed immediately on the open and down since, however there's some initial improvement here.

Bull Flag Fail or Technical Traders Just Being Taken for a Bath?

Last week you may recall the post F_O_M_C consolidation that started as a lateral rectangle, I predicted it forms a bull flag and purposefully so as technical traders search out this pattern that carries and inherently bullish bias. The flag has failed, stopping out longs along the way as predicted in last week's video covering the flag, price has also retraced ALL of the F_O_M_C knee jerk reaction, SO ONCE AGAIN THE F_E_D KNEE-JERK CONCEPT HAS PROVEN ITSELF!

However, while I do not have the intraday charts yet to back up this theory, I do suspect this latest shakeout (the complete retrace of ALL FOMC gains) is part of the larger SPX Futures positive divergences as it also had a beautiful rounding/reversal process as of last night, the move below that area would be out HEAD FAKE, taking out more longs and dragging shorts in to the mIx.

ALL OF THIS WAS COVERED IN GREAT DETAIL IN A VIDEO LAST THURSDAY NIGHT THAT PREDICTED ALL OF THIS ON THE BASIS OF SIMPLE MARKET BEHAVIOR. ALSO WHY WALL STREET FORCES THESE EVENTS AND HOW PRICE IS CVERY DECEPTIVE AS ONE BEARISH LOOKING EVENT IS ACTUALLY PART OF A LARGER BULLISH EVENT WHICH IN TURN OS PART OF AN EVEN LARGER BEARISH SETUP- MULTIPLE TIMEFRAME ANALYSIS.

Although it seems the different trends are working against each other, as I tried to show in Thursday's video, they are in fact all working together toward the same outcome and how you trade it all depends on the timeframe you are looking at, but how you understand the trade for that timeframe is contingent on understanding the entire picture with all timeframes/trends included.

If you missed it or would like to review the concepts  in the video, this is the link to last Thursday's "Daily Wrap", which has an embedded video player and a link to YouTube at the bottom of the post.

The SPY so far...
 From the video, this is the large top formation I envision which is a formation not seen as often, but seems to be the erratic Right Angle Broadening Top. Every H&S top starts as a Broadening top first before it is revealed to be a H&S by the right shoulder. In this case I pointed out in the videos the formation, the technical events that would inspire longs, the resistance and Tweezer top 93-day candlestick price reversal pattern) right at resistance of the formation and the eventuality of expectations on the downside in a primary trend.

This is a chart of volume in the pattern using a custom cumulative volume indicator I threw together quickly that I use to confirm H&S tops as the price pattern attracts every technical trader who sees it which is not hard, but volume is the most important way to reveal a true H&S vs. a random or manipulative price pattern. Early in the market rally around Q1-Q2 of 2010, a H&S price pattern showed up, traders were sucked in, but as we pointed out then, VOLUME DID NOT CONFIRM and in this case, volume is just as important as the price pattern itself, it turned out to be a false pattern and shorts were burned.

The rules of volume for a H&S: An H&S top has essentially 3 parts with 6 trends that make it up unless it's a complex H&S top with multiple shoulders which are still usually symmetrical (meaning if there are 2 left shoulders, there will be two right shoulders, if there are two heads and a left shoulder, there will be 1 right shoulder to match the 1 left shoulder).

On the rally to form the first move up or the left side of the left shoulder, volume often looks as it should for a rally with higher volume, but sometimes it is lower, it's not as important. The decline from the top of the left shoulder should see increasing volume on the downside. Then the ascent/rally to form the left side of the head should see volume dramatically fall off as it rises and as it falls to create the right side of the head, volume should increase dramatically. Finally the right shoulder should see a clear failure in volume on the rise to create the left side of the right shoulder and volume should increase on the decline from the top of the right shoulder back to the neckline.

Other than the fact price doesn't bear resemblance to a H&S as the right side of the head never fell far enough to the neck line, it does look a lot like a commonly seen (technically bullish) early breakout in a Broadening Top, this I believe is part of the Primary Trend head fake.

***The one feature that can give you early guidance whether a top is real and whether it will convert from a broadening top (as I said above, ALL H&S tops start as Broadening Tops first) to the more common or recognizable H&S is volume itself. While volume in a H&S top has VERY SPECIFIC requirements (see above) and as such can be seen as a probable H&S  BEFORE the left shoulder forms which ultimately confirms a H&S rather than a Broadening top,  A BROADENING TOP'S VOLUME IS ERRATIC WITH NO EXPECTATIONS AT ALL, IT  CAN LITERALLY BE ANYTHING, IT IS ALWAYS ERRATIC. 

This is the current SPX formation on a daily chart.
I have marked question marks and red arrows where the volume divergences from the volume expected to see in a H&S top and in white are the areas that are consistent with  a H&S top, this is all academic as the price pattern clearly is not a H&S top, but it likely is a Broadening Top, specifically a right angle BT.


 Here's the SPY Bull Flag that formed and FAILED, technical traders WILL react to it, some were stopped out on the failure EXACTLY as pointed out in Thursday's video. Some of that volume is technical traders going by the Technical Analysis rule, "If a price pattern fails, reverse your trade", meaning if a technical trader was long on the bullish pattern and it failed, they are to reverse to a short.

Then another break as the ENTIRE F_O_M_C Rally is taken back THIS IS THE F_E_D KNEE JERK REACTION I ALWAYS TALK ABOUT, THE ENTIRE INITIAL 1-DAY KNEE JERK MOVE WAS FADED.

Volume increased as support at the start of the rally broke and now we have a nice head fake set up (check volume on the break). Now most longs will have stopped out and many gone short, this is what is needed for our expected short term move as I explained in the video, 1 event that looks bearish is simply a fuse to light the next trend that will appear to be bullish which lights a larger fuse to another event that is the primary goal which is bearish. This is not a random process, this is what Wall St. NEEDS to do to create the supply and demand they need to move in and out of huge positions that would move the market against them otherwise.


 The volume on the FOMC and the break of the flag as well as the complete retrace of all FOMC gains, this also sets up a nice head fake on the intraday reversal process (rounding bottom) that needs a head fake move below its support, that just so happens top be a move that started losing downside momentum as well.

The  TICK chart confirms this with the SPY on top vs. the NYSE TICK and mu custom histogram showing the probabilities which are now bullish for upside momentum on the head fake break, although I haven't confirmed a head fake via 3C yet, although I'll check it as a.m. trade is wrapping up.

The linear regression lines of the SPY and TICK are also consistent with an upside reversal confirming the downside move was indeed a head fake, this gives us a great timing tool for the upside move.

As of this capture, my Custom Russell 3000 "Most Shorted Index" (red) is seeing more upside suggesting a short squeeze, so it looks like retail is buying the shell game or taking the bait.

I'll let you know as soon as we start to see 3C confirmation, but it is not unusual for these head fake moves, ESPECIALLY ONE THAT RETRACES THE ENTIRE INITIAL FOMC KNEE JERK MOVE, to be more dramatic than smaller trends or shorter timeframes, there are several layers of stops in the order stack and Wall St. will go down as far as they can as long as the cost/benefit analysis of getting to the next stack of stops lower still makes sense, if the next cluster is significantly lower, but few in number, it no longer makes sense to bring the head fake down any further. ADDITIONALLY, the deeper the head fake, the more effective its upside reversal becomes as a short squeeze alone creates a stronger move not to mention several other factors which can all be found IN MY TWO ARTICLES "UNDERSTANDING THE HEAD FAKE MOVE" (linked at the top right of the members site.

Monday Morning Futures...

For all that happens over the weekend and the overnight session, it's amazing the market can zip to the upside overnight and then lose that with about a +3/-3 point for the ES high and low on either side of Friday's close, to open -1 point from Friday's close, it's as if no matter what happened last night and things did happen, there was a small up cycle being accumulated late Friday and price returned to just about where it left off to continue that task (that last bit is an assumption that we will have the answer to shortly after a.m. trade burns off), the point being, it is what was expected to continue and price thus far has put itself right where it needs to be to continue. This I believe is going to form the foundation of a new concept or understanding for us with regard to probabilities of opening prices after a weekend when a cycle (even a mini one) is in effect.

The assumption last week was the market itself was very weak which I pointed out last night with any money being spent in the accumulation stages, largely being spent in only the most influential parts of the markets, the Averages and the Industry groups which have the most directional pull on any given stock on any given day. The SEC itself estimates market direction accounts for two thirds of any given stocks direction on any given day with the second most influential force being Industry groups, so considering what this cycle is for (considering a confirmed Tweezer top is already in-confirmed Friday), it's little wonder there's so little attention paid to the rest of the market. Thus the assumption was that any engine influencing the market intraday to the upside will be Currency Carry Cross related of SPY Arbitrage or both.

It's too early to see if the 3 assets that are the basis of SPY arbitrage come together for a 3rd day as they did Thursday and Friday, but I suspect they will.

As for currency carry pairs, the Dollar is in shambles on the open this week, but the USD/JPY was never the assumed pair to drive the market (very short term), it was the EUR/JPY or more likely the AUD/JPY and futures have interesting confirmation information there as well.

I'll cover oil, which EXACTLY as the charts predicted, first saw upside and now have seen downside, but it was not a trade I was interested in because the charts predicted the highest probability was near term price chop with an overall bearish bias that should be the eventual outcome after the chop fails.

Lets look at the futures themselves as of the open.

 ES 1 min overnight since the Sunday open gained and a clear 1 min negative divergence set in to bring us back near the area where it closed Friday, this being important because I've always felt this was a concept of continuity during the tactical part (Accumulation or distribution) of a cycle.

 The 5 min charts still have a positive divergence, even more so than last night suggesting our analysis from late last week was spot on, still recall that it's not expected to look like much to most than noise unless we see proof that the accumulation zone is larger, then it might hit some limits/stops, but for now, it looks capped by the confirmed bearish reversal from Wed/Thurs./Fri. of last week, which also played out exactly as described in Thursday's video as soon as the first part of the formation occurred, the video predicted the bearish confirmation and what it would look like and Friday fulfilled out expectation with the daily candlestick's close.

 Yet ES and the other major Futures Indices are capped by larger negative divergences at 30/60 min which is a very serious threat to the market in the IMMEDIATE future.

 This is crude which 3C predicted would move up, but in to a zone of chop, it did move up and now down , continuing the expected zone of chop. I'm looking for  GOOD SET UP IN CRUDE ON THE SHORT SIDE AS THIS ZONE OF CHOPS LOOKS TO DRAW NEAR AN END.

 Gold has retraced a significant amount since the F_O_M_C rally, the 3C negative reversal at the top is clear, but the slowing of momentum with a slight positive forming is interesting as gold would likely move with ES (the market), yet it still looks like a counter trend correction to the upside that will resolve back toward the prevailing sub-intermediate downtrend, which will likely help gold accumulate more as a sub intermediate bullish trend grows a larger base.

 Silver lost nearly ALL of its post F_O_M_C parabolic gains, this is a concept I use often, "The Parabolic Move", I never trust them because they more often than not fail as quickly as they went up or down initially, thus traders chasing price have precious little warning to get out before they are already caught at a loss.

The 10 year Treasury futures (really the benchmark that sets nearly every other interest rate in the US from your credit card, to a car loan, a student loan, even a mortgage) look to be in consolidation at best, but note 3C in the flag or pennant area after the F_O_M_C rise, then look at the difference on theses 15 min charts on the 30 year T. Futures chart, something that has been going on for months.

While price in the 30 year futures looks not too dissimilar, the 3C chart does, (think about our TLT trade or possible trade-I have liked TLT, the 20+ year T-bond ETF  for sometime with little explanation beyond the charts) this is why I maintain my interest in the 20+ year longer dated treasuries as they have a distinct difference vs shorter dated or the benchmark 10 year.

I'm not ready to make any moves in TLT, as I said, I'd like to see a pullback to at least in the $102 (or less) area, although longer term it doesn't matter, of more importance to me is how to leverage up TLT without losing liquidity.

We're still right on track from expectations.