Tuesday, August 30, 2011

And There You Have It

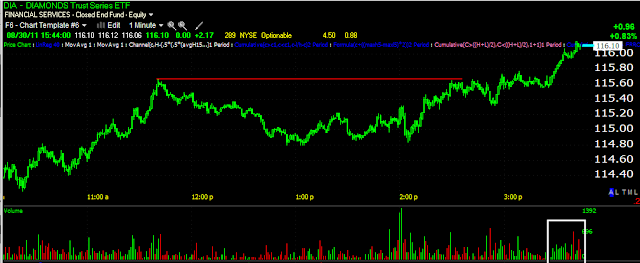
 DIA 1 min

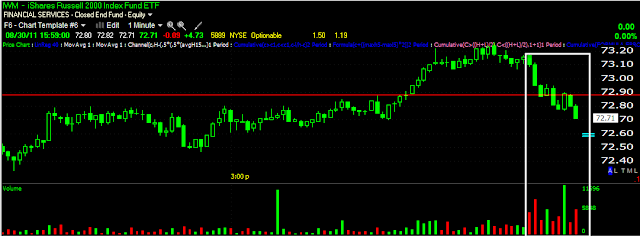
 IWM 1 min

 QQQ 1 min

SPY 1 min

Look at the volume on the break as well, there's short seller in there.

In my last post at 3:49 I said, "We are in very fertile ground now for a reversal or gap lower tomorrow."


Two minutes later the market headed down on volume!

Market Follow Up

In my 2:40 post, Market Reversal I drew in some trendlines and said, "watch for a possible slight head fake above the red trendline as a solid signal and a move back below it"


Here's an update on those trendlines and where the averages are in relation...
 DIA 1

IWM 1

 QQQ 1

 SPY 1

TICK chart


In all cases we are above the trendline as I suspected we might see. The point and purpose of this is to draw in longs who are buying what they see as a breakout, you can see on several charts volume expanded as price crossed the resistance level. When the market heads down, these longs are caught at a loss and start selling, adding supply to the market and causing the averages to fall harder then they otherwise would.


The TICK chart shows that the up-trend is starting to get shaky. We are in very fertile ground now for a reversal or gap lower tomorrow.

FX

 FXE 15 min leading negative divergence suggesting the dollar will see some decent strength, which is equity negative as well as commodities and energy.

 The 10 min FXE chart showing the same...

 UUP positive leading divergence on the 15 min chart...

I've been getting a few questions about targets, it's difficult to say, but as I mentioned yesterday, the point of the move is to inspire confidence in the short sellers, so it could look pretty nasty, although we'll be able to see the underlying action in any decline. I don't know if a move back in to the triangle will be enough to convince short sellers that the triangle was a failed pattern and induce them to sell short or if a bigger move below the triangle will be needed. We should have a better idea once it starts.

The long term charts of the market reman positive for a move higher after this shakeout.

Correction again

Sorry, too many emails, AGQ is a long silver trade, that is what I meant. sorry for the confusion.

Correction

I listed AGQ as a short term trade, that is a short in silver, that is not what I intended, I am looking for a short term long in silver so scratch AGQ off the list.

For shorter term traders...

We have numerous longs out there,many of which I featured late yesterday afternoon, you may want to lock in some profits or at least get a trailing stop behind them. For longer term traders, you may just want to sit it out if your risk management will allow for it, at the end of this you may have an excellent add-to pullback.

Trade Idea SVM (long)

This is another short term trade based on the probable move higher in SLV.

 A breakout bove the trendline should put some real momentum under SVM-this is a short term trade and needs to be watched.

Here's the 30 min chart in a strong leading positive divergence.

One more...

TMF should see some safe haven buying on a market dip

Some Short Term ETF Trades

These are short term to play the dip in the market and most are leveraged...

SRTY
SQQQ
SPXU
FAZ
VXX
AGQ
TZA

Watch the correlation for risk management purposes.

Market Reversal...

 DIA 1 min-we are close to the reversal, watch for a possible slight head fake above the red trendline as a solid signal and a move back below it

 The QQQ 5 min shows it has already made the slight head fake, so it's ripe.

And the SPY 5 min is very close...

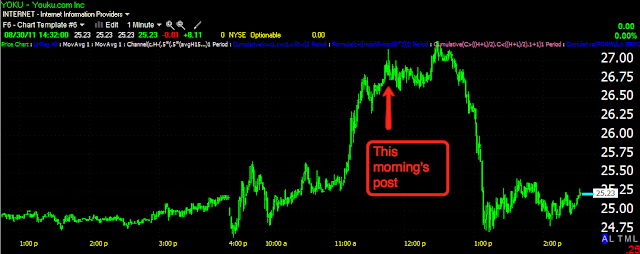
YOKU Follow Up

Remember the earlier chart request for YOKU...

There were a couple of problems in the short term that I thought a pullback would go a long way toward fixing. The 5 min chart was showing a negative divergence which was welcomed, and YOKU has given way to that divergence, now over the coming days we'll watch for accumulation for a solid run a t a breakout.

Make sure to check out the linked post if this is a trade you might be interested in.

Market Update

As I mentioned last night, a downside head fake will have to be convincing, otherwise there's no reason to even run it. The way these 10-15 min charts are shaping up, it's looking like the pullback will be sharper then what we were looking at yesterday. Just keep in mind the nature of the longer term/ longer trend charts and how bullish they are. So we should be in for some volatility. If you want to run a short term trade and can watch t during the day, you could use inverse ETFs of the market indices or go long VXX, however, the short swing trade on VXX I believe I would let stand unless you are the type how can trade nimbly in and out of positions.

 DIA 10 min leading divergence is getting sharper.

 IWM 15 min leading negative divergence is also deeper.

 QQQ 10 min is still in a leading negative position, the 5 min has given more ground.

And the SPY 15 min negative divergence.

SPY Update

 SPY support zone triggered stops, see the rising volume. One of the biggest spikes was at the break of $121-STAY AWAY FROM THOSE WHOLE NUMBERS!

 1 min SPY and a positive divergence to test resistance after the break of support.

 SPY 5 min is leading negative

 So is the SPY 10 min

And the SPY 15 min just turned leading negative. I wouldn't be long the market/SPY here for short term traders.

USO Update

What did I say!!! In the last Energy and USO update today, USO was trading up, I said,

"Interestingly USO is up a bit this morning, I haven't seen anything big in the news, I would look to see if there's anything going on with tensions between Israel and Egypt."


And the Headlines on DrudgeReport today....


Here's the story... And that's the reason USO is trading up.

PCLN Chart Request

I think at some point PCLN is going to be a good short, in the long run, I don't think we are there yet, but t is one of the stocks that have been on my watchlist because of my expectations for the market. A member asked about when PCLN would make for a short, there are two answers...
 PCLN is what I call a bullish momentum floater, so long as there's some bullish action in the market, the longs that have traded PCLN for the last several years and have made a bundle are emotionally attached to the stock. This isn't a good thing, but when you keep going to the same watering hole and always find water, you develop habits. My belief for some time has been the market would rise enough for PCLN to make a new breakout high above overhead resistance, the bulls will rush to buy PCLN on a new high. Some time after that as the market begins to fold, PCLN should show distribution on what will probably be one of the most vicious false breakouts we have yet to see.

 The 30 min chart is in line at the green arrow, meaning the trend is confirmed as PCLN's price makes higher highs, so does 3C. This makes me think over the intermediate term trend, PCLN can accomplish this new high breakout. For those of you trying to better understand 3C, look at the negative divergence on this chart in red, note that 3C is lower at the second relative point then it was at the first relative point (marked by small red arrows), however price is higher at the second relative point then the first, so we have price moving up, 3C moving down. This is a relative negative divergence because it is relative between two points and there is less institutional money flow at the second point when prices are higher, meaning institutions have been distributing or selling, this precedes the reversal down. Remember institutional selling can include short selling, 3C sees selling as selling and does not distinguish between selling a long position and selling in the market of a short position. So the big short that I see for PCLN is still some ways off.


 There is a smaller short of shorter time duration that may be available . This 15 minute chart is often the chart in which we see swing reversals on divergences between price and 3C. Here we have price heading higher, but 3C heading lower, showing less institutional money n the trade at higher prices, meaning they have been distributing or selling short.

 We have confirmation on the 10 min chart of the same.

 We also have a leading negative divergence on the 5 min chart, it is leading because price is making relative new highs while 3C is making relative new lows. A leading divergence is one of the strongest and being it is on the 5 min chart, it is likely to spread to the more important 10-15 min charts.

The 1 min chart also shows a negative divergence at the open when PCLN made a brief rally attempt in a parabolic way.

Being we have a negative divergence on the 15 min chart and confirmation of negative divergences on the 1-10 min charts, it is reasonable to think PCLN will see some short term downside and be a short sale. Because the 30 min chart is still very strong, I don't see this as a key reversal, just some downside over the next day or two.

SLV Long

I think SLV may be a decent intraday trade, maybe even a bit more...
 SLV with a positive divergence yesterday sending it higher today, it's been in confirmation thus far today, probably feeling a little pressure from the strength in the market, but that should reverse shortly.

 The 10 min's chart right now has a slight leading positive divergence...

The 15 min chart is the kicker, this is a pretty long leading positive divergence, so I would not be surprised to see SLV move higher from here.

Market Update, BE CAREFUL

If you look, there's a lot of 1/5 min confirmation, but the 10-15 min charts are still negative, I think the bulls are being set up here.


 DIA 1 min

 DIA 5 min

 DIA 10 min

 QQQ 1 min

 QQQ 5 min

 QQQ 10 min

QQQ 15 min

 SPY 1 min

 SPY 5 min

 SPY 10 min

SPY 15 min

YOKU Chart Request...

 YOKU Daly chart broke out of a nice little triangle base, I'd like to see volume pick up a bit here.

 There's accumulation on the 60 min chart...

 Same on the 30 min chart-so this has been building a base and probably has more upside to go with this much accumulation.

 The 15 min chart prepared the way for today's move higher

 As did the 10 min chart...

The 5 min chart shows the possibility of a pullback, I think t might be a good thing and if YOKU does pullback and gathers some more momentum, I'd like to see volume pick up and I think this could run to the $27-$28 level.