Much like the counter trend move we have been expecting in 30 year Treasuries which are also in a downtrend/bear market, we have an excellent example of how strong these bounces/rallies are-this not during a bull market uptrend, but a bear market downtrend. As I said several times before and earlier today, because it is a counter trend move, it needs to be convincing and thus these counter trend rallies are some of the strongest rallies/bounces you'll see, even (or especially) in a bear trend!

We waited for the intraday low (white trendiline) TO BE TAKEN OUT AS THAT WOULD HELP MOMENTUM WITH A SHORT SQUEEZE AS NEW SHORTS ENTER ON THE BREAK BELOW CLOSING AND INTRADAY LOWS (above).

This morning CPI data came in hotter than expected with gold's initial move lower on $USD (F_E_D Hawkish tone) strength. However the $GLD/gold futures positive divergences are in place on inflation expectations starting to run hotter (Gold is typically bought on inflation expectations as a hedge to inflation).

The 3C accumulation/positive divergence suggests (as do numerous other assets) that the CPI print was leaked at least 1-day in advance!
Gold's initial reaction (as well as stocks, Treasuries, Crude, most commodities and equities) declined on the stronger $USD which was reflecting a more hawkish tone toward rate hikes as inflationary pressures are one of the main things the F_E_D is looking for to begin rate hikes.
As for gold futures, we started seeing this yesterday (another sign that the CPI data was leaked a day in advance) , POSITIVE DIVERGENCES suggesting the upside we had expected yesterday on a weaker $USD was coming today. However it was not on a weaker $USD, which means gold was reflecting more positive inflationary pressures as gold is bought on inflation expectations as a hedge to inflationary pressures.


Obviously we are expecting near term gold appreciation making our closure of the Put position near the exact intraday lows as well as our Call position entered near the intraday lows yesterday. WE SHOULD SEE GAINS IN TO OUR CURRENT OPEN GLD CALL POSITION EARLY IN TO NEXT WEEK.
The early weakness on the hotter than expected 8:30 a.m. CPI print sent Equities (as mentioned above) lower in to an op-ex Friday in which the max-pain pin is usually close to Thursday's close.

As last Friday's (May 15th) The Week Ahead forecast indicated:
"I don't think the bounce is quite complete or its reversal process is not quite complete which means that my first assumption would be that the market would be rangebound and choppy in the area finishing the reversal process"

See today's The Week Ahead for expectations/forecast for next week. There are numerous indications that suggest the forecast for next week and beyond is right on, allowing us to enter numerous position which we did not have solid signals for this week and good thing as the week was flat.
Our newer positions opened this week and very recently including Thursday's Trade Idea IWM Short/Puts & Trade Idea: SPECULATIVE QQQ Puts as well as Wednesday's Trade Idea: VXX should all do well in to early next week...
Although I do expect a "Chimney" as part of the head fake in the "Igloo with Chimney" price pattern to play out...
The concept of 3C charts picking up where they left off in the cash market even over a weekend or even a long holiday weekend, should see the positions entered this week at a gain early next week as today's closing 3C charts/signals are all reflecting early weakness which would be in line with the "igloo" price pattern finishing before the head fake Chimney which "should" allow us to take gains on the new options positions as well as enter new, longer term positions on the head fake move right after booking gains on the new positions above on early week weakness.
Here are examples of how the 3C charts finished today and what that means for the market early in to next week which is in line with our current positions opened this week (from above)...
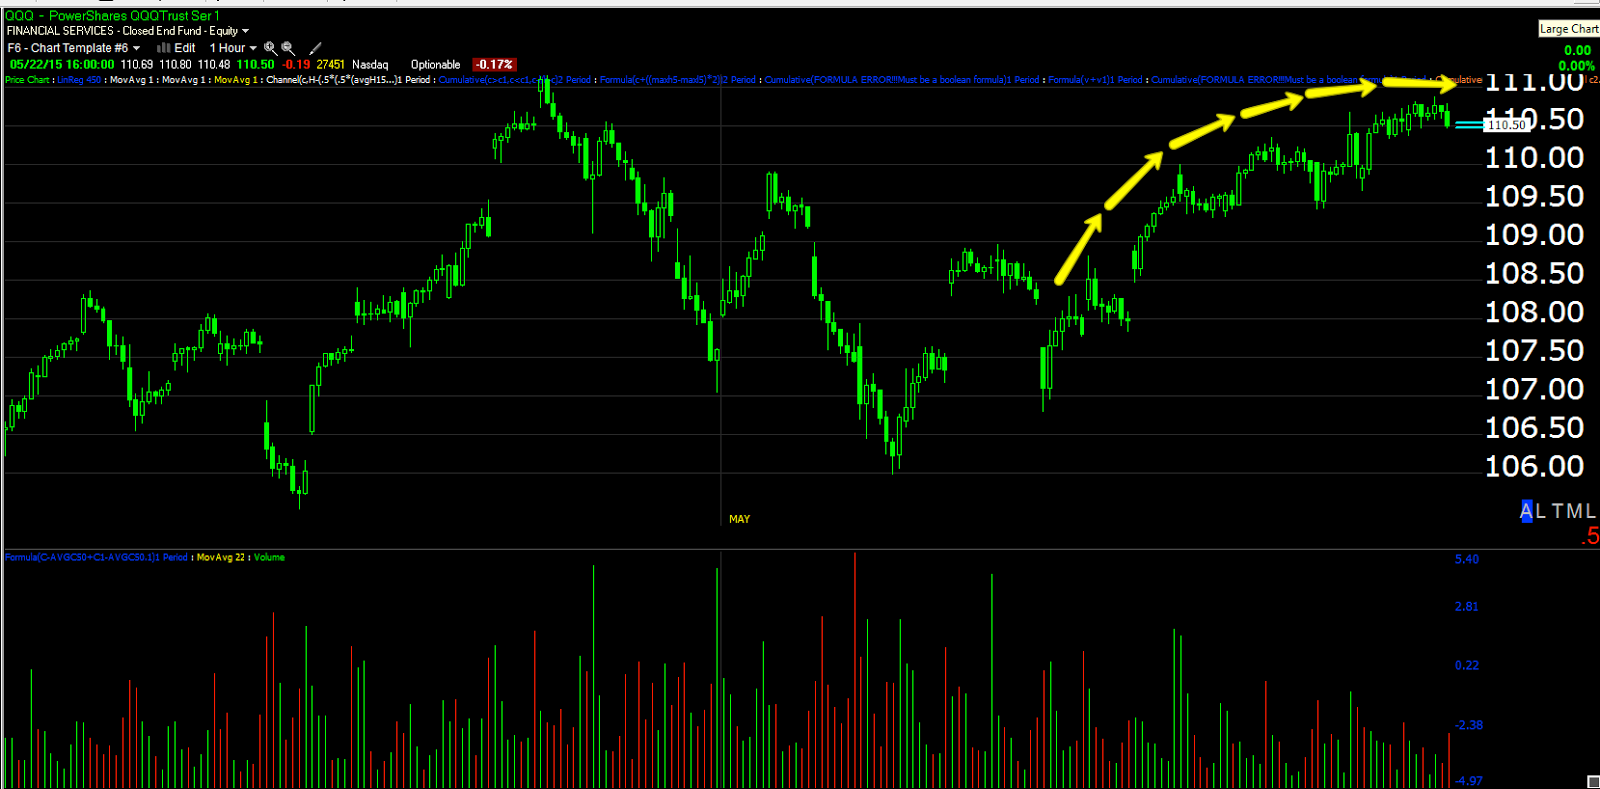
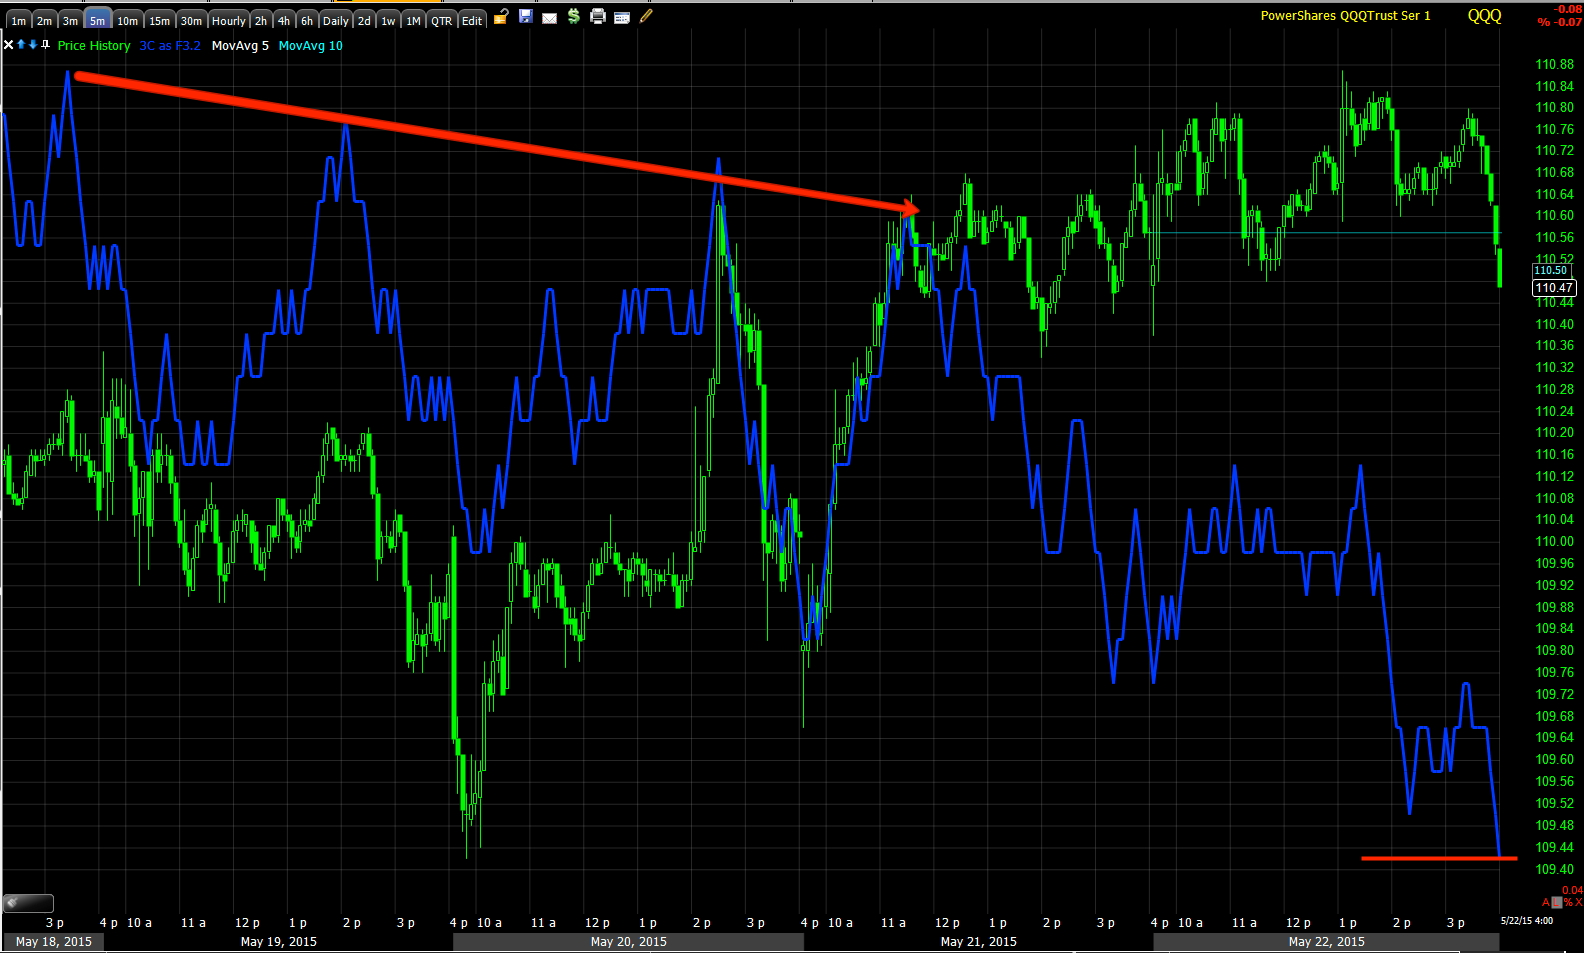
QQQ signals for early next week... "Picking up where the 3C signals left off"

SPY...


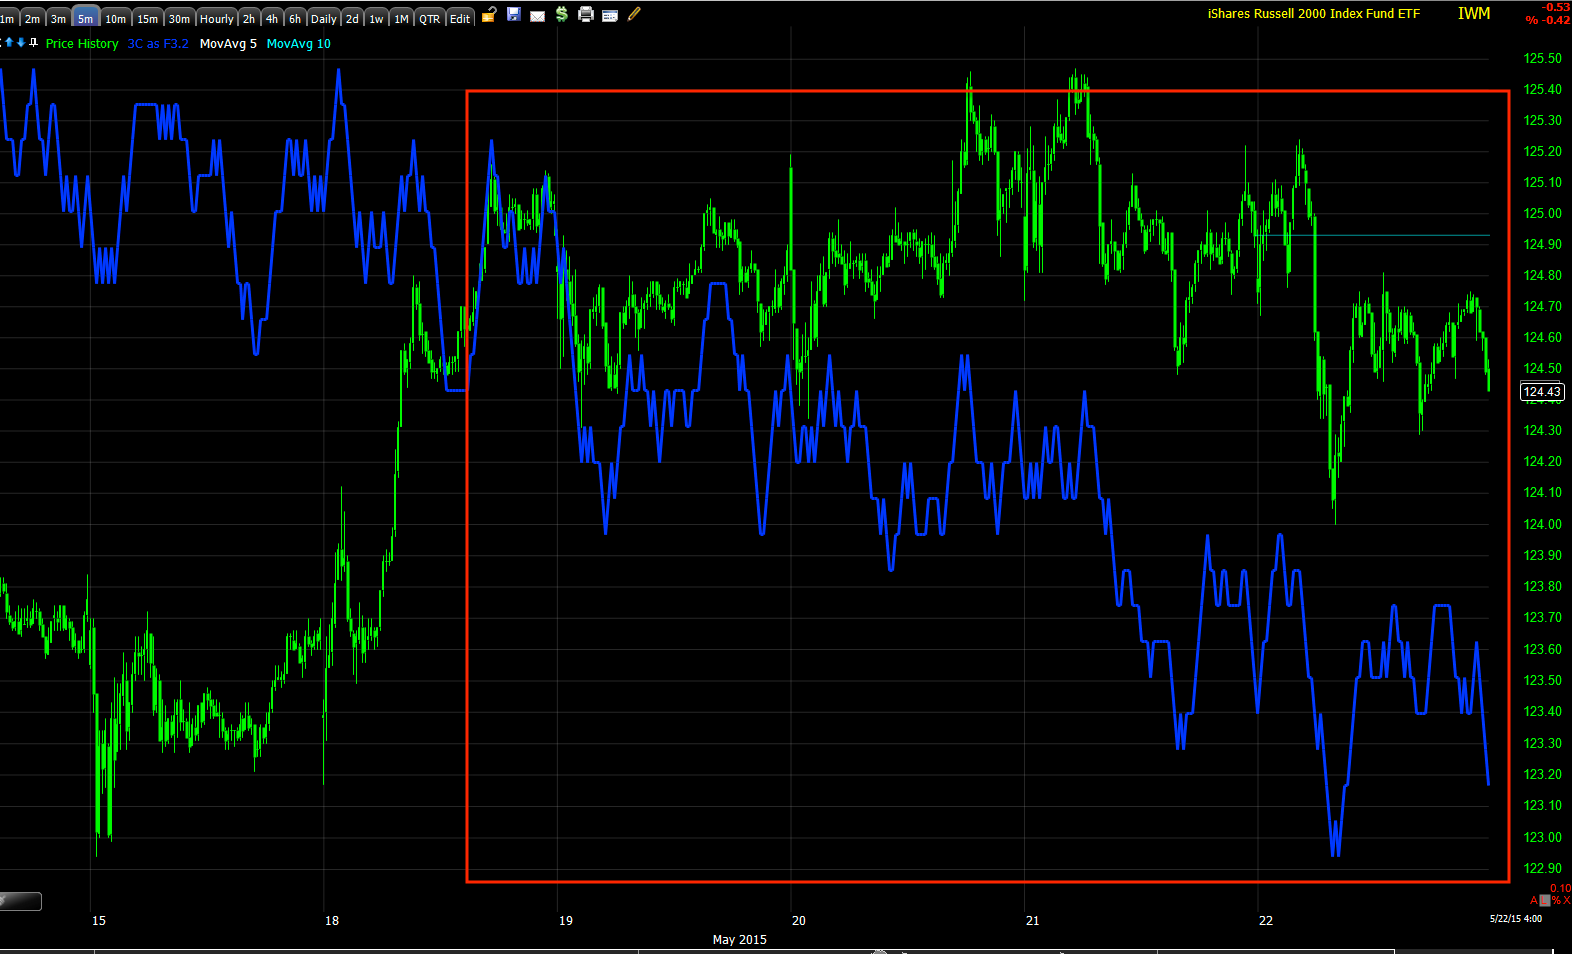
IWM...

VXX

VXX intraday 3C closed the day with a new leading positive divergence suggesting early strength in VXX which trades opposite the market so we have confirmation (multiple asset confirmation) with the VXX 3C chart above and should see early gains in VXX calls just entered this week with last week's call positions closed at gains of +56%, VXX Call P/L


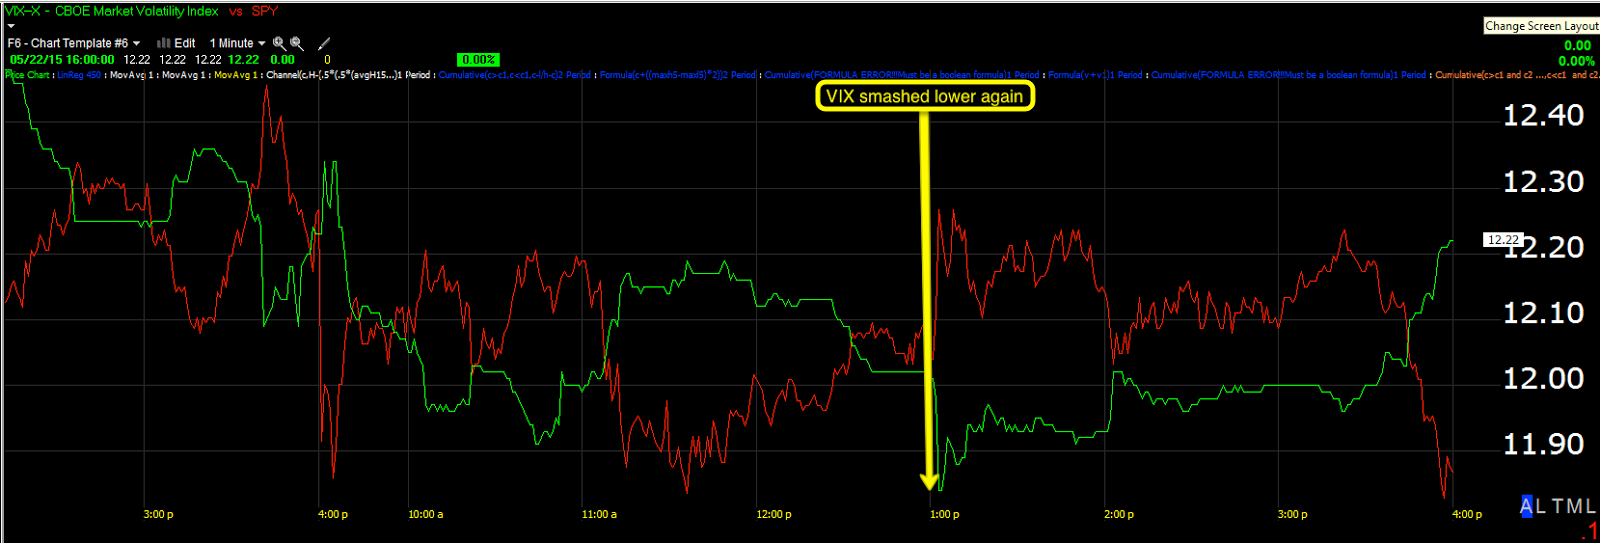
Speaking of VIX, did you notice that once again today it was SMASHED lower?

This means the QQQ/IWM Puts should be at a nice gain as well as the VXX calls before a head fake move allowing us to enter new positions which should fail as the VXX (short term VIX futures) above show 10-15 min longer term charts also pointing to upside (market downside).
We have numerous Index Futures confirming as well, this is just a small sampling...


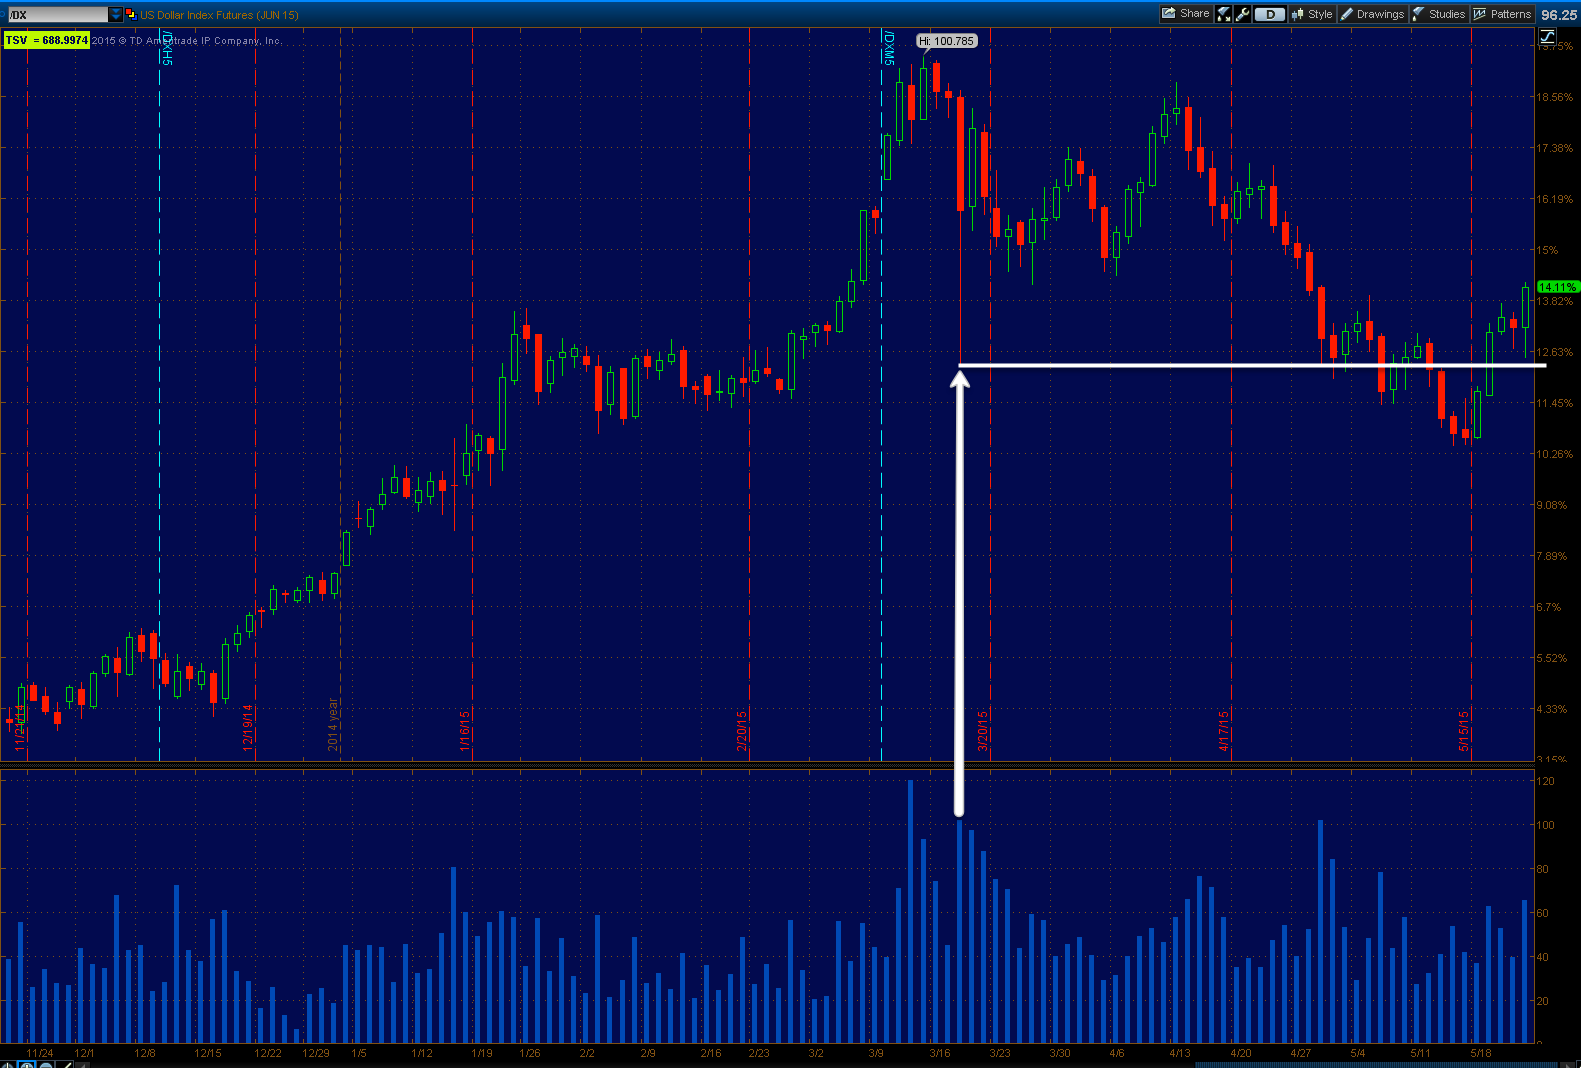
Remember the expected trend in $USDX, which should be in line with the 60 kin charts above and also reflect the continuation of the $USDX downtrend and the end of the counter trend bounce we are currently in the middle of.
This would also reflect the continuation of the carry trade unwind so it would not be surprising to see increased downside momentum as the $USDX returns to its primary trend...
I'll have crude updates early next week as well as gold and the averages.
Otherwise, the indications in today's The Week Ahead should be accurate.
As for Internals, they are mixed with Close Down/Volume Down which is the least influential and the Dow with Close Down/Volume up with 17 stocks, a 1-day oversold condition, although not confirmed by the other averages.
Sector performance would tend to agree with the Dow's Dominant P/V relationship with 8 of 9 sectors in the red, a short term oversold condition with only Financials green at a mere +0.04% and the laggard being Industrials at -0.45%. A 1-day oversold condition, but not that strong.
Of the Morningstar groups, also flashing a 1-day oversold condition with only 71 of 238 groups closing green.
Once again, just eye-balling the SKEW Index, while not in red-flag territory, the upside rate of change is increasing and I'd expect SKEW to be pushing red flag territory next week.
Otherwise the Futures indications aren't as important on an intraday basis, it's the 3C charts closing sentiment which I have covered above.
We have tons of items on our trade watch list and I expect sometime toward the middle or later next week we'll be throwing out new Trade Ideas and set-ups as the initial weakness allows us to take gains on current short term option positions and enter longer term trend positions as the $USDX's counter trend rally comes to an end and the carry trade unwind continues with the $USDX's primary trend lower.
Any additional information I have to add I'll do so over the weekend. Other than that, I am wishing you a very peaceful and happy weekend with the longer Holiday weekend and Monday closed for Memorial Day.
Have a GREAT WEEKEND!


