Some of the big boys are showing pretty good relative strength
AAPL
INTC
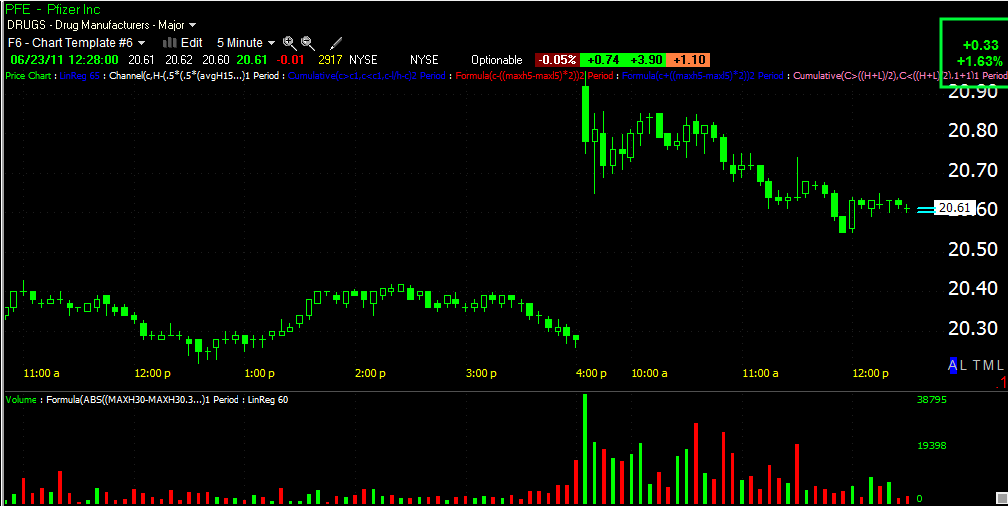
PFE
As for the market, understand that Tuesday we hit resistance at the $129.75 area, that's when I started seeing some negative divergences develop and started talking about the need for the market to pullback, regroup and basically accumulate to make another run at the resistance level. Wednesday we had slightly higher, but marginal gains, 3C continued to fall apart suggesting as I said yesterday, we'll see a pullback which is not a bad thing so long as the underlying 3C action shows some accumulation in to the pullback.
Accumulation has to start somewhere and that is on the 1 min chart. As accumulation grows stronger, it will move to the 5 min, 10 min and 15 min charts. By the time accumulation is obvious on the 15 min chart, we should have enough fuel to launch a new test of resistance.
Here are the current market charts:
DIA 1 min showing some decent 1 min 3C positive and leading positive divergences.
DIA 5 min with both positive relative and leading divergences
The IWM hasn't shown much yet on short timeframes, but the hourly chart is encouraging that it hasn't taken a deeper dive.
QQQ-early morning divergences suggested the Q's would back and fill into the gap. Right now, the 1 min is in a leading positive divergence.
The hourly has also held up well.
SPY 1 min. relative and leading positive divergences.
SPY 15 min chart has held up pretty well thus far.
As for financials, FAS has been lateral in a price range, but 3C is in a leading positive divergence
There are similar signs on the 5 min chart
As well as the 10 min chart.
I suspect averages like the Q's will pullback a bit and hopefully we'll see some stronger divergences on the intraday pullback. Right now the positive divergences are rather slow in building. An event in the SPY like a brief break of the 200 day moving average around $121.20 could trigger a lot of stops and that could allow for a nice pop in accumulation, we'll have to see if something like that happens and watch t closely to make sure there is accumulation on such an event.