Friday, October 12, 2012

Weekly Options pin

I suspected this earlier, the weeklies are getting more influential, this from a member just now....

Agree on this Brandt... Closes we're AAPL under 630, QQQ under 67, SPY under 143 and does not seem likely these were random... 

AAPL is one of the better examples, but there were several averages with bullish reversal candles put in today, on a few of them I can't get the closing/consolidated volume until I update.

 AAPL's big break below the neckline didn't see the type of follow through technical analysis teaches we should see, instead the support of Tuesday held the entire week, seems a little like a pin, however we also saw a very bullish candle in not only a Doji today, but with yesterday an even stronger Harami reversal set up, these work better than people give them credit for, as for volume, I wish it were higher, but it is a Friday.

 SPX also put in a bullish Star today, volume isn't updated yet, I expect it isn't higher though vs yesterday on a Friday, note the past bearish shooting star and Doji reversal candles.

 I went a little crazy with the QQQ reversal candles, but the range from this week held and we saw a very bullish Doji, which shows indecision in the trend down, which opens the door to a reversal, the average closed nearly where it opened.

And the Dow, today it put in a Doji with long wicks, prices on the up and downside were tested, it closed near the open, a very nice looking reversal candle, however again, we stayed within the range of the last couple of days, perfect for an options pin.

MCP

I've had several questions about MCP today and while the intraday trade was ugly, this one has a lot of volatility and the up and down moves are larger than most are use to-yesterday it was up over 4%, no technical damage whatsoever was done to the base we are interested in as MCP is a slightly longer term trade idea.

Here are the charts in a nutshell

 The range defined almost a week ago hasn't been broken at all, the custom "close within the range" indicator at the bottom is very bullish with closes typically in the top of the range.

 The 30 min chart off the last pullback coming together here.

 And more importantly for today's trade, the 2 min intraday going very positive around 1 p.m. and just kept going.

Even the next timeframe showing the pullback from yesterday shows the positive today.

This is how bases work, people think a stock moving up on volume or without volume is smart money buying, they are much smarter than that, they buy weakness as you can see today and sell in to strength, their positions are much larger and take more time to build, that's one of the most fundamental misunderstandings traders have and that is "part" of the reason why we see head fake moves just before a reversal and or stop runs and limit order runs.

FXP Long

I covered FXI and FXP (CHINA 25 long and short leveraged ETFS) a few days ago, FXP is in a position I can't pass up.

Many of the charts don't even need explanation.

 FXI the long China leveraged ETF is outside the Bollinger Bands 2 days in a row on weak candles, this is a channel buster and not bullish as it appears, also my demark inspired indicator is giving a sell/short signal.

 All of the charts in every timeframe for FXI are negative, I'll try to show several, here's the 15 min with recent rapid deterioration.

 More importantly for timing the 2 min today

 FXP is the short version and should look exactly the opposite in the signals, this is the one I bought. The 4 hour chart needs to explanation.

 Nor does the 15 min.

And more importantly for timing, the recent behavior of the 5 min today.


Decided what to buy

I mentioned I was looking for a leveraged ETF to buy, it's FXP today.

Charts are coming next, but this is one I CAN'T pass up

Additional thought on FAS

Actually I just forgot to mention it, as long term members have seen and as one of our main entry trading tactics, a false break is one of the last things that happens before a reversal.

Take a look at that FAS triangle one more time...
A break below the triangle and on that break, the only real positive divergences in Financials.

Food for thought.

FAS As a QUICK Long Trade

Or perhaps a call (options) in financials, the point being a very quick move up in financials and it sets up the short as you can see by JPM's earnings this morning, their revenue streams are all down and like banks do every earnings quarter, they simply released their loan loss reserves to make income earnings look stronger than they are knowing most people don't even bother with guidance, just a beat or miss.

I believe this is the true reason for QE3, a bank re-capitialization and a reason why QE3 could be very different than 1 or 2, consider it as the same in essence as the ECB's LTRO 1 and 2, then French president Sarkozy said the extra money going to the banks at 1% interest for 3 years would send sovereign yields lower as they bought up the sovereigns in a carry trade; borrow from the ECB at 1% and make 5, 6, or even 7% on the sovereigns of Italy and Spain as well as others. What really happened? The ECB's overnight deposit facility saw record inflows of money from the banks that were willing to borrow at 1% and get .75% interest in the ECB deposit facility, essentially losing .25%, but having capital they very much needed, no they weren't buying sovereigns or stocks, they were hoarding cash for what they knew was and is coming.

I suspect QE3 isn't much different judging by the Financial sector and the urgency from the F_E_D, Ben still probably has nightmares about those few months in 2008 when the entire sector nearly imploded.

 Any way, the FAS trade (Financials 3X long).


 In what is another reason for the market to rally in the next week, Financials which didn't get beat up to badly and thus haven't been on my list of long trades, are in a perfect triangle, a bullish consolidation/continuation pattern. Traders expect the financials price pattern to break to the upside and before we get any significant downside, that head fake move will happen, thus a short term trade in FAS should work, then you'll have something to short in to.

 The long term 60 min 3C underlying trade for FAS/Financials, leading negative which confirms the head fake scenario above.

 Here's the triangle and 3C has stuck with price for the most part, not offering any recent opportunities.

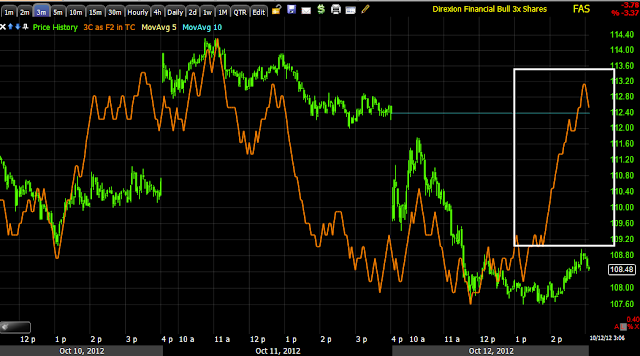
 However today the short term charts are flying in leading positive momentum for an upside breakout in FAS/Financials-2 min

3 min
And this after really nothing positive.

So if you are nimble, you can play financials from the long side for a quick breakout to the upside of the triangle, you'll want to be watching updates for the negative divergences and the opportunity to trade with the underlying trend and reverse to the short side for the longer term, but you should be able to make money in both directions, only the upside move won't have as much potential, thus the leveraged FAS as the trading vehicle.

AAPL Charts

I suspect AAPL is in a weekly options pin, you'll see why below.

 Yesterday's bearish price/continuation pattern with the break below, since then....

5 min leading to new highs today starting with the break below support.

 There's a bigger bearish triangle in place, I'm not sure if traders caught on to it, but I'm sure they have, it's also like Bollinger Bands squeezing for a directional break.

 There's several reversal candles in place and AAPL hasn't violated the lows pretty much all week, I suspect this is the weekly options pin, but since the hammer reversal, those lows at $623.55 have held despite what the intraday trade may feel like. Yesterday and today have formed a bullish Harami Reversal with the doji/star inside yesterday's real body. Increasing volume would be nice to see on the close.


AAPL

If I thought it were worth it to go long AAPL stock here, I would, it may be one of the last decent long trades in AAPL. As you know I opted for calls for the leverage, I'm working on the charts now, but I think today is the last chance.

ERX - Case in point

About an hour ago I brought you the ERX trade idea (long) as it was down 3.2% and at a low level of risk, below support.

Now...
ERX is above that support level it had broken below and started to move up, it's still in a reasonable risk/reward area, but the risk was lower an hour ago.

Market Update

Just as I was putting this post together as it looked like a move higher was about to start, it started moving higher (SPY), you'll see as the charts toward the end have price moving higher. The pivotal parts are in place, that was the point of the post, we do have weekly options expiration so it'll be interesting to see what the SPY does, but as for the swing move, we should be right at the bottom of the swing down and thus any long positions you may have been considering for a swing move up, you may want to get in place now.

This is a 10 min chart that shows the last swing reversal down and where we are now. I say it often enough you are probably sick of it, but 80%+ of the time, just before a reversal either up or down and on almost any timeframe, we see a head fake move that fails and brings about the reversal. At point "A", just before the head fake move up, the last day in the uptrend, there was resistance at two points, it gapped to both and failed, the move down started as the breakout move failed. We have the swing positive divergence in place right now, we also have a price move below support and of the last several days that looks like a failed attempt to move higher and thus a more bearish break below support, this is no different than point A's very powerful (initially) move up. The point being, the pieces for a reversal are in place, a strong positive divergence, the head fake move and on intraday timeframes...

The red line is yesterday's close, note the flat trading range, this is what I call a dull market and dull markets are dangerous markets because there is something going on and they catch people off guard, you can see the 1 min positive divergence during this flat period, note price to the far right hasn't moved yet as I continue to capture and annote these charts.
 
The 2 min is positive in the range and price is just starting to move, I was putting this post together because I thought a move was coming very soon and you may want to tie up loose ends, get positions in place.

The 3 min chart is leading positive, looks great in the range, price to the far right is moving as I'm capturing the charts, that's why I put out the last post as I knew it would take some time to get this one out.

And the 5 min intraday leading positive very strongly and to the far right, price is moving from the range.

I think we are VERY close and I'd be looking at whatever positions you may want to close and what positions you may want to open in advance of a reversal. I can't say where the weekly pin will be, but I'd say by early next week we'll be on our way higher and you may not have a chance to get positions in place at these levels.

Move Higher about to start

ERX Trade

If I didn't already have ERX, I'd consider ERX long here if for nothing else, a swing move in the range, here's why...

 This is Energy, XLE broadly which includes oil and services. This 3 min chart shows it breaking just below recent support on a nice positive divergence, but the added bonus of the trade is the stop is so close.

 Longer term, along swing trade lines, the 10 min chart is positive at the same area, but XLE alone doesn't have the leverage in this range to make the trade worthwhile.

 ERX is a 3x leveraged Energy bull ETF, the 15 min swing timeframe chart is positive like XLE at the same spot, right on a break just below support. The thing is, we see head fake moves happen about 80% (or more) of the time just before a reversal in trend, it has a lot to do with momentum, but there are a lot of reasons.

In this case I would probably size the risk more along the lines of speculative just because of the range and I'd have a stop on a CLOSING BASIS-not intraday- just below $50, maybe $49.87, but $50 is too obvious a stop level.


 ERX 2 min, like XLE is also positive at this move just below support that triggered stops/volume in XLE.

 The opposite of ERX is ERY and showing the opposite signal, 10 min swing is negative

3 min intraday is leading negative as it breaks just above resistance.

My initial target for an ERX swing trade would be up around $55.

TQQQ Swing Long-Market Proxy

TQQQ actually makes a pretty good proxy for the overall market, after a few more things I need to look at, I'll be looking around for some additional longs to add for a swing trade up, likely leveraged ETFs as they fit the bill pretty well, but who knows what is looking good this moment.

Take a look at TQQQ as Tech is my favorite as far as being at the bottom of a rotational cycle, there's no way I could look at these TQQQ charts today and not buy TQQQ, I'm already set there though.

 TQQQ with a doji daily candle today and right at the break below a neckline, where volatility shakeouts are most often ran to the upside.


 The 15 min (a good swing timeframe) chart showing Rate of Change of price moving to the upside as downside momentum fails, Wilder's RSI also in a positive divergence here.

 The 30 min chart isn't my favorite swing example, but just to show you a positive divergence has reached as far as the 30 min chart, there's more than enough accumulation for a swing move.

 I prefer the 15 min chart for swing moves, this one leading positive, this is a fine example or start of an example of how a reversal is not an event, but a process.

 Now starting from the short timeframes, the trend of the 2 min went from relative positive to leading positive, when the shorter term charts are really moving, typically the market makers/specialists are stocking up for an impending move.

 2 min chart intraday today

 3 min chart's transition from strong relative positive to strong leading positive

 And the opposite of TQQQ, SQQQ's 15 min chart in a leading negative divergence

 The short term 3 min SQQQ also increased downside leading negative momentum.


AAPL Intraday

The further AAPL moves up, the more effective yesterday's false break below the bearish descending triangle will be, so far, the intraday trade looks good.

 Yesterday morning AAPL didn't confirm on the open as it had a negative divergence, but just like the SPX chart I showed you yesterday of this same exact pattern on a larger scale that put in the June 4th bottom we have rallied from, AAPL was already positive going in to the bearish price pattern before it even broke and then had a more positive divergence on the break, the same as the SPX, today it is leading further.

The 5 min chart also sums it up nicely, the non-confirmation yesterday on the open as AAPL had a small head fake on the open with a break above the close from the day before, then a positive in to the bearish price pattern, more positive in to the break below and a leading positive. The higher AAPL moves up, the more the shorts from yesterday and others are squeezed.

Market Update


Another Interesting/Volatile start to the day.

Here are the charts...
 The QQQ 2 min intraday picking up some strength on a move just below first support at yesterday's close...

 QQQ 5 min looks good...

 As does the 15 min chart which is typically a pivotal timeframe for a reversal or trend along this timeframe (swing).

One of the reasons I think the Q' and Tech look better than Industrials and Financials is AAPL believe it or not...


 The bait was taken on yesterday's bearish descending triangle and now price is moving above that triangle with a positive divergence at the break below, which is what we want to see on a false break.

 SPY 1 min is in line, it's not negative or positive, but looks like a shakeout of $143.

 ES which was negative pre-market at JPM earnings on accounting gimmicks to beat, is now at a positive divergence, SPX should see some upside shortly.

 JPM went from pre-report of $42.99 to a post report low of $ 41.14 and after filling the gap, remain volatile, almost as if it were a surprise they beat on an accounting gimmick.

 SPY 2 min is also positive like ES, which makes sense as the ES charts are stronger.

And there's been no damage to the positive divergence for a swing move that the SPY 15 min chart has put in.

Some other indications this morning...
 High Yield is up vs the SPX, credit almost always leads stocks, even on an intraday basis, but there's a longer component too.


 $AUD/FXA is positively divergent in the same area as 3C vs the SPX, this has always been an excellent leading indicator.

 Even the Euro is positively divergent, which means the SPX should move higher based on legacy arbitrage alone without divergences.

Finally High Yield Corp. which has been an excellent leading indicator is leading the SPX quite strongly, credit leads, stocks follow.