Tuesday, February 5, 2013

Daily Wrap

Last night's closing post took about 5 hours and was pretty thorough, everything made a lot of sense and fit pretty well. Today started out as expected, a volatile move (increasing volatility) to the upside as we had positioned yesterday for such a move in weekly IWM calls.

What I noticed early today was that even the daily signals we've been able to ply pretty effectively were starting to get sloppy, but later in the day something changed and there were quite a few stocks on the long side looking better than I'd expect, even AAPL with it's performance today had some decent underlying 3C signals. The futures as well and you might have noticed the weekly QQQ put was a week further out, that was a little uncertainty I was feeling with those signals popping up, with Credit acting better than it has recently.

However after taking some time away from those thoughts, I came to the realization that these were some changes that happened in the second half of the day, it's not a large trend, it's not something that's been there for days or weeks and there was deterioration in to the close.

The VIX wasn't that impressed with the market today and we saw that early on in VXX and UVXY signals which were pretty strong intraday.

While the SPX moved toward 2/1's level, the VIX (red), didn't move anywhere near the same level on 2/1.
 VXX 1 min leading really strong intraday

And the long term 60 min also leading strong.

Futures had me a bit concerned, but as the night wears on they are starting to loo like themselves again.

 ES 1 is not that big of a deal right now...

 The 5 min chart seeing 3C move with price was something new, I see it starting to come apart now so again, I can't over-react to a few things that were there for several hours.

The NASDAQ futures (incidentally where the QQQ put is)  are seeing some early overnight weakness.

Volatility is doing what I said...
Rather than these big intraday percentage moves adding to any trend, they are spinning their wheels and just churning out volatility and nothing in the way of trends or gains.

As I said toward the end of the day, some of the strength I was growing suspicious over started showing weakness.

 DIA 2m

 DIA 5 m

 DIA 15 m

 DIA 30m

 QQQ 2m


 QQQ 15 m

 SPY 1m

 SPY 5m

 IWM 1m


IWM 5m

As for the Dominant Price/Volume relationship, interesting, there weren't too many that were dominant, rather they had a co-dominance that was Price Up/Volume Up which is the most bullish and Price Up/Volume Down which is the most bearish -these are short term as in next day, but...


 The Russell 2k was clearly in the dominant bearish camp and its the most important as far as I'm concerned.

The S&P also was in the bearish camp with dominance, this is also another important one.

So I got to thinking and I now the ECB's rate decision comes up Thursday, we could see some movement in to that rate decision, perhaps even bullish and then a sell the decision type move.

I think most people wouldn't expect the ECB to do anything with rates, but since Germany printed a negative GDP number, a lower Euro would certainly help exports and maybe keep Germany out of a recession, so maybe they move rates and send the Euro plummeting or they can leave it alone and pretend Europe is strong because of the currency, but everyone knows different.

So Thursday, a move from the ECB could send the Euro plummeting, that would not be good for the market and if consensus id that is the most likely course, then one last Hoorah to the upside while they still can would make sense, it would also gel with some of the more bullish looking longs I saw here and there today. This is why I wasn't actively calling out a bunch of shorts today and why I too the weekly QQQ puts, but next week instead of this week like we have been doing.

The bottom line really comes down to the fact that there were all the signals expected until the second half of the day and there were some changes, but a half a day is hardly reason to go changing anything, it's a blip on the screen, maybe it looks significant in price, maybe not, but it certainly doesn't change anything of importance to me.

If things change dramatically, then I'll be more concerned about whether I'm on the right track, but the timing today and the ECB on Thursday, it seems to me like perfect time to make one last run and that may be why credit looked a little better today, but Credit is SOOOO far away from being close to normal, I don't have any concerns there.

For now I'll stick with the positions called out, some scattered longs, some scattered shorts and look for a chance to use price strength to short in to with 3C signals that are moving the right direction in to any price strength.

I really feel that this is more about the ECB than anything as this is the first time they may actually have to do something and that something would throw the carry trades in to a dizzying orbit of pain, we could very well see the gut feeling quick move up and gigantic move down if that happens, remember that was my gut feeling for the actual reversal?

If anything comes up, I'll post it for sure.

Bringing AMD to Speculative Long

AMD is a position we were long for a decent profit of 27%, we closed it out as a pullback looked likely, I maintained a small tracking position to keep it in mind that is up 10% and at this time I see AMD as worthy of at least a speculative size position, leaving room in your risk management to bring it up to a full size position.

Here's what happened and what I see now.

Many of you will probably remember the events in AMD being a low priced stock, each of these moves were pretty significant and for those who don't recall, this is a great look at typical market behavior including when, where, why and how technical traders are used so smart money can get their way.

A) Downside Capitulation, a big move with a lot of volume as long traders essentially all throw in the towel at once; this create a great source of supply for smart money to accumulate, but the capitulation move that typically marks the end of stage 4 decline, often drifts lower in the construction of a stage 1 base.

B) Obvious, defined trading range- It's important that all 3 characteristics are met, the more intense each of the characteristics, the more effective "C" and "D" are.

C) Crazy Ivan Shakeout / Head-Fake Failed Breakout- Both occurred the same day. "Crazy Ivan" comes from the movie, "The Hunt for Red October" and is a Russian submarine tactic to stay hidden from enemies. The only place an enemy sub can follow another is right behind them in their prop-wash of what are known as the baffles, the submarine that is following masks its own noise by staying in the target sub's own noise. The Russians found a way to "Clear their baffles" and make sure they aren't followed, it's called a Crazy Ivan and is simply a 180 degree turn toward any following/oncoming submarine-forcing the other sub out of the prop wash and exposing them to acoustic listening devices, it's kind of like a game of chicken.

In trading I call a run of the stops and orders both above and below a range, a "Crazy Ivan", they essentially have cleared all the stops and orders. In doing so in this case, it also cause a breakout above the range that obviously failed, note higher volume in the area.

D) Head-Fake-False Breakdown. Because Technical traders are so predictable as is human nature, they identify a support level and think that support should hold, that's what Technical analysis teaches, so a stop just below support should be effective as far as they are concerned, it also allows them to keep tight stops and take on more shares, that's greed and the wrong tactic for a trade that is still working itself out, it needs room. However the drop below the range causes sellers and short sellers to come in to the market creating supply again, which can be accumulated on the cheap and in a very liquid market. After that accumulation period we see a break to the upside which brings us to...

E) Symmetrical Triangle-Consolidation/continuation pattern. There are 3 types of triangles in the consolidation range, 1) Ascending (right angle) triangle which is assumed to be bullish according to Technical Analysis, 2) Descending  (right angle as well) and assumed to be bearish and symmetrical which has no bias itself, the bias is determined by the preceding price trend just before the triangle forms. It is assumed that the sym. triangle will continue the preceding trend, at least by technical traders. We have an upside breakout from the apex of the triangle that leads to...

F) Another Crazy Ivan. You can tell limit orders and stops were all hit the same day just by looking at the increased volume that day, it's about 70% more than the average.

G) Head Fake breakout/ Failed Breakout. However in this case, I believe it was specifically designed as such to allow more accumulation of AMD which brings us to the 3C charts.

 This long term 4 hour chart removes the noise and reveals the strong underlying trends or flow of money, I labelled what each color means for some of our newer members: White =positive 3C divergence/accumulation, Green=3C trend & price trend confirmation, Red=3C negative divergence/distribution. Arrows=relative divergences, 3C is compared at two relative price points whether they are the same or one is higher or lower, these are typically the first divergences seen and are the weaker of the two types. Box around 3C, either red or white=Leading negative or positive divergence, this is the strongest divergence and tells us there's heavy activity, these usually appear after a relative divergence.

 We were obviously interested in AMD recently with accumulation in to price lows.

 As price moved off the lows our position was at a nice gain, however the yellow box denotes a head fake move-usually above or below a defined level traders watch, it could be support/resistance, price pattern breakouts, moving averages, new highs/lows, etc. The point is, it's a false move and we see these pop up about 80% of the time before a reversal, there's a whole study of head fakes, how we know when they are coming, how we can use them to our advantage and why they are used by Wall Street. These two articles I wrote are the first tow of a 3 part series all about head fake moves.

Part 1-"Understanding the Head-Fake Move...How Technical Analysis Went From an Asset to a Trap"

Part 2-"Understanding the Head-Fake Move...Motivation"

In any case, after the move we get a pullback with a positive divergence in to the pullback telling us AMD is apparently being accumulated at lower prices, which is what we want to do as well.

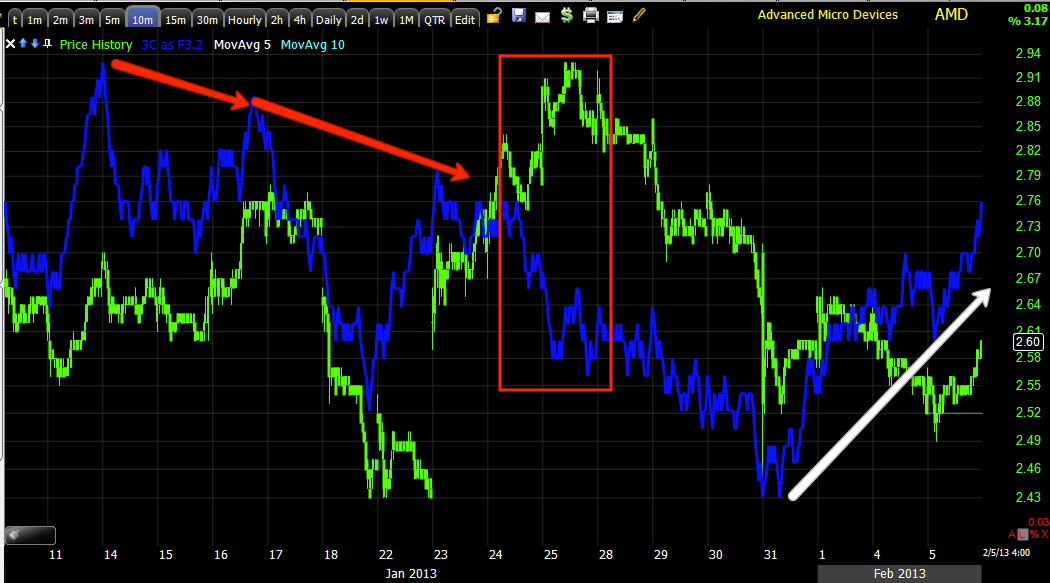
 This 10 min chart shows a relative divergence first as price makes a higher high and 3C not only fails to make a higher high, but in fact makes a lower high. Then at the top we see a leading negative divergence as distribution picks up in to higher prices and demand, this is the head fake and traders are trapped there at a loss. As prices move lower we have a relative positive divergence turning in to a leading positive divergence.

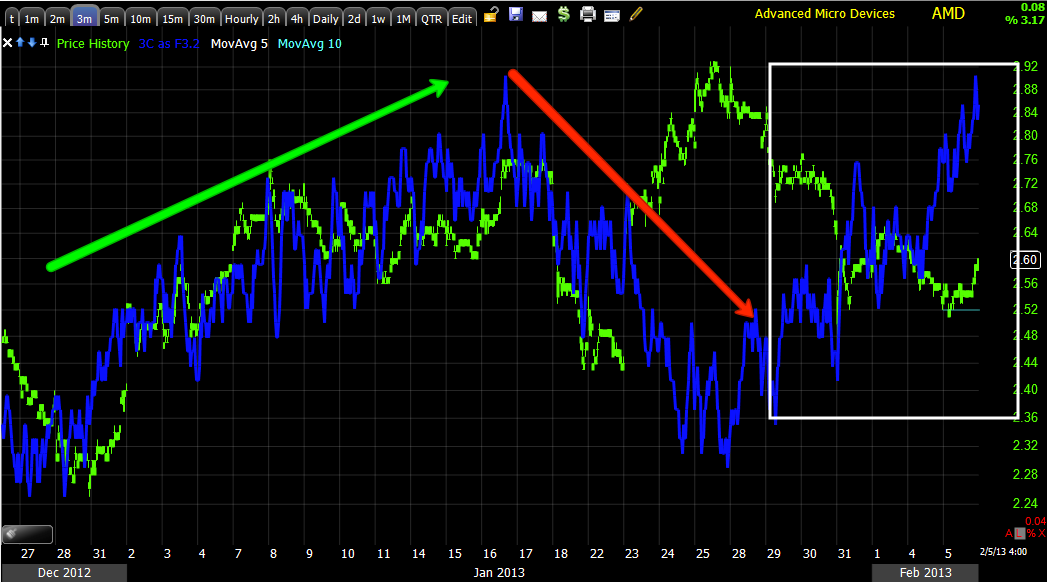
 The 3 min chart shows a lot more detail and it's a different level of activity, usually market makers or specialists rather than the heavier money flow of institutional traders, we have confirmation, a leading negative divergence (just drawn with an arrow) and a leading positive divergence. Essentially there was some level of accumulation almost as soon as prices moved lower.

 Using my X-Over Screen which is a trading system itself, we see a sell/short signal at the far left at the three red boxes on each indicator, this stays bearish as only the price moving averages crossover briefly, known as a whipsaw, this system is designed to eliminate getting whipsawed out of trades as the other two indicators don't agree at the orange boxes. At the white boxes we have a long/buy signal.

I actually prefer the longer 3 day trending system for a stock like AMD, but you have to have the stomach for the draw-down, the faith in the system, the patience, the risk management that allows for larger consolidations and corrections and the account that can handle the draw down without creating margin call issues as I never meet a margin cal with cash. These longer trading systems back test much better, they need a lot less of your time and they have a lot less transaction costs including slippage. The first short on the chart made 40% conservatively, the next long made another 40% on the conservative side, the short made 70% and the new long is just getting started. This is a good system for those that prefer confirmation and higher probabilities over squeezing as much out of the trade as we can or for those that can't watch the trade as often.

Others would prefer to trade around the consolidations and pullbacks and you can certainly make a bit more that way, but you have to have the time and it's better suited toward larger accounts that aren't effected by transaction costs (i.e. a $5000 account using reasonable risk management might have a $1000 position limit, if you make 5%, that's $50 and the transaction costs could be $20 if you have a $10 trade fee; however if you have a $100k account, the same 5% is $5k and the transaction costs of $20 are negligible.

In any case, AMD looks interesting as a long here, I'd prefer to phase in to it.


FB Update

THIS IS ANOTHER POST I WAS WORKING ON TODAY, BUT HAD TO ABANDON IT DUE TO MORE PRESSING MARKET MATTERS, IT'S THE FOLLOW UP FROM THE FB SHORT POSITION COVERED EARLIER IN THE DAY.

Well I managed to squeak out of FB with a small profit, which to me is the same as a small loss. I believe in the FB short (for a decent swing, I think that could lead to a new FB long position later as well)), but I don't believe in exposing you account to a situation that isn't going anywhere at the moment.

The uncertainty in the FB short, could be what most people call "dead money" or "opportunity cost", I look at it in more severe terms, "No matter what asset you are in, no matter how safe it is considered, whenever you have money in the market it is at risk" so you should have a pretty darn good reason to have it at risk.

Look at MBS, Mortgage Backed Securities, these sounded like the safest bet going, an asset backed by real tangible property and what happened with MBS? They put us in to recession. Even in a trade that is working in your favor, you have no idea if another 9/11 happens (I pray that it doesn't) or some other out of left field event.

Here's what FB looks like as well as what I'm watching for and my plan based on certain things happening.

The FB gain of a mere +3.05%, nearly a full size position.

This is the 1 min. chart

The 3 min chart also has a leading positive divergence.

The 5 min chart shows a good negative divergence/reversal down, but now there's a positive divergence. I don't know if these are done and will lead to a move up of a couple of days or if they build a bigger base and lead to a stronger move up. I just know that if I looked at FB today as a new short position, I wouldn't take it here or now.

The 30 min chart which is where the longer term or big picture probabilities are to be found, clearly shows a top pattern that could be an incomplete H&S top or a broadening top, the volume is not correct for a textbook H&S and although most price patterns are never like you see in the books, volume in this pattern is essential to determining whether it is a true H&S top. A Broadening top however (which all H&S tops start as first) does not have any volume requirements and volume is often very random in these tops. The impression I get is we had a left shoulder that saw distribution, a head and a break below the neck line.

Do you remember what my choice entries are when confronting a H&S top? I either want to be in at the top of the head where my entry is the best price wise and my risk is the lowest or I want to wait for the initial break that all retail technical traders short and wait some more for the volatility shakeout back above the neckline that almost always happens to shakeout those initial shorts as Wall St. knows how technical traders will behave, when and where they will short it (on a break below the neck line) and Wall St. runs these volatility shakeout move to the upside to make traders believe it is a failed pattern, causing them to cover at a loss. After that occurs, then I want to look at a short position near the top of the volatility shakeout.

There is a gap as well and the market (especially apparent today,) has been moving more and more to fill gaps.

Here's what a Broadening top would look like, we have two breaks below the neck line, the first was a head fake and the second I presume will be a head fake based on the 3C charts above. If FB makes another bounce that has a high lower than the January high, we may have a H&S pattern. The point is, with a shakeout level so close at the red trendline and 3C looking the way it does, there's no point in being short right now as it is likely price moves above the red trendline for at least a short period of time and maybe more.


Looking at the 2 hour chart, we can see the big picture, we can see how the base that we predicted in early August formed and how it led to a rally in FB that had good 3C/price trend confirmation (green arrows) and then a leading negative divergence (which is the top area we were just looking at. The point being, cause and effect is clear here in the 3C signals, some sort of top and deeper pullback is likely at some point, I just don't feel strongly that it is ready right now.

Lastly, after a decent pullback, maybe to the $25 to $26.50 area (which happens to be a rough price pattern implied target on the downside) there's a good chance that FB could continue higher. We'll know if that is the case by looking at the 3C charts as a larger pullback takes place, but for now, the short term accumulation suggests higher prices so I see no point in waiting for FB to turn from a slight gain to a loss and even more bothersome, I see no reason to have precious portfolio reserves deployed for sub-par timing for the trade. There's nothing wrong with changing your mind if you have evidence, you think smart money doesn't do the same?

Finally, I had to widen the Trend Channel to get the appropriate fit (for those using the TC, increase the median from 10 to 20 and the ATR components from 11 to 21 each, leave channel width the same) for the FB trend, the channel has held the entire trend without a single stop out (remember a stop out is on a closing basis) until yesterday. However, remember that most often, after we have a TC stop out, price tends to get volatile and sloppy, it could be volatile and sloppy enough to move above the neckline I showed. When the Channel turns down, then we have a higher probability short trade, until then I'll stay on the sidelines.

Second Half of IWM Calls P/L

Around 2:55 p.m. today I closed the other 25% of the IWM calls opened yesterday, the closing trade / charts kept me busy and unable to post the final P/L as there's a strange look to some of the charts as the day wore on as well as an eclectic mix of long and short trades that each looked good;  I'll get in to the newly developing situation as I have more insight in to it; there's a fairly high probability it is a simple anomaly. In any case, here's the P/L for the last 25% of the IWM call position-the first 75% was closed at a +50% gain.

The final close of yesterday's call position  (Weekly IWM Feb. 8th $89 Call) brought in an extra 2.27% at 52.27%

Take a look at the chart of the IWM...
This shows where the position was opened as well as the initial and final close of the position for roughly a +50% gain for a day again, not bad.

Here's the positive divergence in the short term 1 min chart yesterday in white and today's negative, this was intended to be a 1-day position.

With the earlier position, the total profit was $5,550 for a day.


I'm not sure holding on to the position for another couple of hours was worth it or not, I was hoping for a more volatile pop out of the earlier flag to boost the premium, but it was more of a steady climb. In any case, we've had a pretty steady stream of solid short term signals amongst this increasing volatility, so... as long as the market is giving, we are taking and hopefully not giving back.


Strange Looking Market

I'll elaborate after the close, but today's mix of long/short trades is a bit eclectic. Here we have some of those short term negatives kicking in.

Closing Out 70% of IOC Short

Basically with a 24+% profit in IOC, I'm just letting the profits run until/unless I see better looking charts. I look at the situation like this, "If you had no position in IOC, would you short it today?", the answer would be "No", so I can't justify holding a full-size position in the equities model portfolio.


VXX Looking Better, You Know What That Means


 Strong leading positive 1 min chart, the divergence is migrating, it is just starting to move to the 5 min chart...

5 min

VXX looking better and better

The Q's are looking worse and worse, feel fine with the put position in the Q's

More Confidence to Join the Short Side

As far as adding to or establishing some new shorts, one of the things that had me stumped earlier and is now changing and lending more confidence to fade this move up both o a short term and a longer term basis is the fact that credit is disconnecting from the SPX... Both HYG and Junk


High Yield Corporate finally disconnects from the SPX and on volume

Guess What Else Looks Good Here... BIDU!

It's not so great with a loss in the position on the drop, but as a new position it looks intriguing, I'd prefer to wait and see if there's more lateral movement for a little bigger base, at that point I might even consider it.


Call me Crazy

I don't get it either because other than Energy which I might (if I had no exposure) consider a partial position here, a lot of the shorts (ETFs) like FAZ, SPXU, SQQQ, SRTY, etc are looking pretty good here, but the AMZN calls that I'd think should look bad, actually don't so I'll leave that position open for now.

Going With QQQ Feb 13th $67 Puts

That's long the puts

Closing Rest of IWM-Likely open QQQ Put

I'll let you know if I do, I think this move has to be faded.

Tough Call

Volatility is EXTREME, look at the "V" shape in the Q's and the +1.73% gain, 3C is going negative in several timeframes that were positive and the Q's are right in the gap, this is becoming a very tough cal as to whether we have more volatility, but I'd guess some short positioning in this area makes sense based on the lower risk

Covering FB Short For Now

Big Hint?

I think so, a lot of assets really look like they are gap filling, I just noticed a large positive divergence in VXX and UVXY on the 1 min, this is really large, I have a feeling once the gaps are all filled, the market tone changes.

Market Update

Looking around so far the market is behaving (in certain areas) better than expected, for instance most leading indicators, while severely divergent otherwise, are in line or pretty close today.

CONTEXT for ES is pretty close to inline, their SPY Arbitrage model shows the SPY rich to the model.

My 3C charts in some timeframes, like SPY 1 and 2 min are in line(still confirming price intraday), but at 3 min on, they are pretty negative, again there's a thin, thin line.

The DIA doesn't look quite as good on the 1 and 2 min, the 5 min looks horrible.

The QQQ 1-5 min looks really good, even with this very parabolic move (volatility is increasing) and it looks like it's heading for yesterday's gap.

The IWM is the one that looks like REAL indecision.

I'm going to check a few other assets and some potential trades and see how they are looking.

For now, I'd think we might keep going until some gaps like the Q's are filled, IWM already is and it's not doing anything right now.

IWM / Futures Update

The IWM trade from yesterday worked out well so far, I closed 75% and left 25% open.

 Keeping the profits on these short term option trades is what is important, volatility plays a role, understanding about how much of a move we can expect and what the market environment is like is also critical. A 50% gain is no record setting gain for an options trade, but for a solid signal given yesterday and less than a day of exposing capital to risk, it's a great trade and it's one in a long line of these  1 day quick moves which is less a function of my choosing and more of what the market is offering.

 Just like earlier, Es is still negative so I'm leaning toward this being a persistent negative divergence which (at least on the 1 min timeframe) we only see in the futures and it has been a strong signal both bullish and bearish as well as somewhat rare.

 The NASDAQ 1 min futures were exceptionally clear about their positive divergence yesterday, they were somewhat in line at the open although negative from the accumulation area running through approx. 12 a.m. EDT (to the far left). The fact these futures are not confirming is bothersome.

 As for the IWM, much like the head fake move and gap in the QQQ, the IWM had a similar move and just like the QQQ which we predicted would fill that gap, the IWM has down the same today and met resistance there.

Gap resistance or support for that matter, is some of the strongest I have seen on a consistent basis. The IWM ran up and formed a flag pole early on when the NASDAQ futures were still in confirmation, then the IWM hit resistance as the gap was filled and formed a flag, the futures went negative there. As far as the price pattern, regular technical traders see this as a perfect bull flag, volume and all so there's going to be some expectation of a breakout to the upside from here, that is why I'm willing to leave some open still, I suspect it would be a head fake move, but a move nonetheless.

 As mentioned, the volatility isn't useful for anything really except quick in and out trades, it's not adding to any stable trend. Considering volatility shows up near the end and a lot of other indicators are falling apart, the "BlackSwan" factor is increasing.

 The 1 min chart and consolidation

 The 3 min chart with the head fake and gap filled, look at the size of the accumulation, I could see that position near distributed by now.

 The 5 min chart and an in line status, this could go either way fast, it went leading negative very fast at the last run up.

 At 10 mins, there's not even a very fine line between this move up and serious negative damage and tone.

The 5 min intraday indicators have lost momentum, MACD and the embed on Stochastics isn't very strong here.

Hopefully we get a decent head fake pop to sell in to and consider adding or starting a position in SRTY if you like the IWM as a leveraged short which I do,